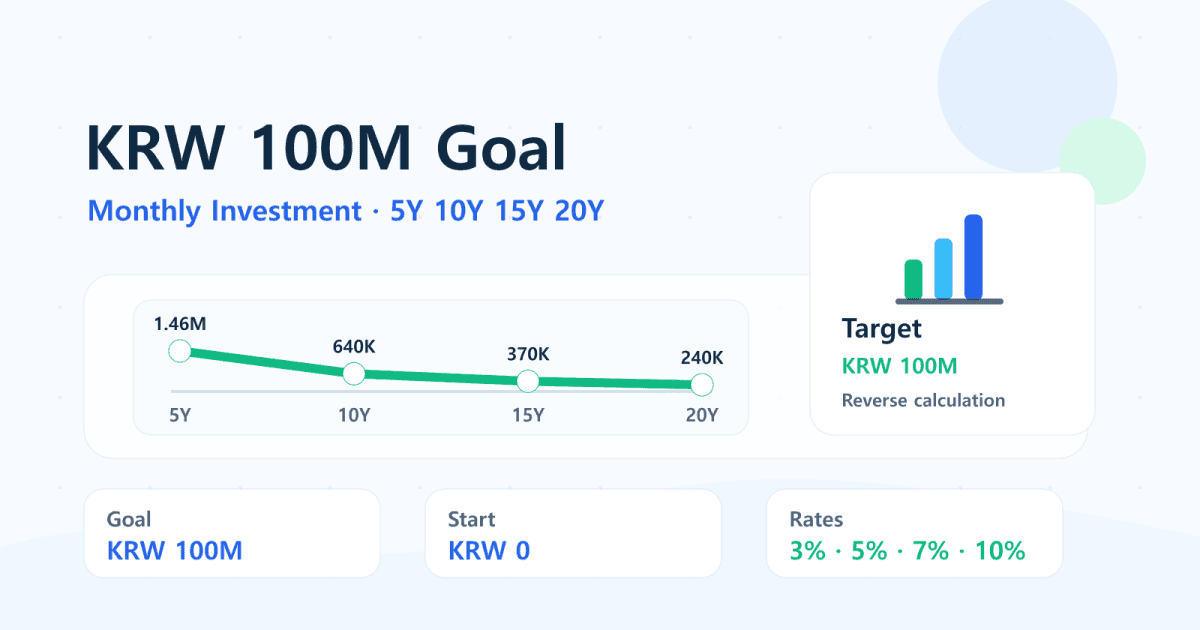
This page is a monthly contribution table reference for two example goals: a $100,000 target portfolio and a KRW 100M Korea goal. It shows how the required monthly contribution changes by timeline and return assumption; for the broader after-tax planning workflow, use the target portfolio monthly investing guide.
This article is educational. The tables are calculator estimates, not investment advice, return forecasts, or product recommendations.
Quick Answer
| Question | Short answer |
|---|---|
| What does this page show? | Reference tables for a $100,000 target and a KRW 100M Korea goal. |
| Is this the general monthly investing guide? | No. For the broad workflow, read the target portfolio guide. |
| What changes the table results? | Timeline, return assumption, starting balance, taxes, fees, inflation, and contribution timing. |
| Which FinMap tool should I use? | Use the Goal Simulator for target tables and the DCA Calculator for monthly investing paths. |

How to Read the Monthly Contribution Table
Read the tables as reference grids, not as personalized recommendations. Each row starts with a target amount and works backward to estimate the monthly contribution needed under a specific timeline and return assumption.
Target portfolio = future value of current assets + future value of monthly contributions
If current assets are zero and contributions happen monthly, the required monthly contribution falls as the time horizon gets longer or the assumed return gets higher.
That does not mean a higher return assumption makes the plan safer. It only means the calculator needs less cash flow under that assumption.
$100,000 Target Portfolio Example
Assumptions:
| Input | Value |
|---|---|
| Target portfolio | $100,000 |
| Starting balance | $0 |
| Contributions | Same amount every month |
| Compounding | Monthly |
| Taxes, fees, inflation | Excluded for comparison |
| Years | 0%/yr | 3%/yr | 5%/yr | 7%/yr | 10%/yr |
|---|---|---|---|---|---|
| 5 | $1,667 | $1,547 | $1,470 | $1,397 | $1,291 |
| 10 | $833 | $716 | $644 | $578 | $488 |
| 15 | $556 | $441 | $374 | $315 | $241 |
| 20 | $417 | $305 | $243 | $192 | $132 |
The main lesson is not that 10% is "better." The lesson is that the monthly amount is highly sensitive to time and return assumptions.
To test your own target, starting balance, and timeline, use the Goal Simulator.
Return Assumption Sensitivity
For a 10-year $100,000 goal, the monthly contribution changes sharply as the assumed return changes.
| Annual return assumption | Required monthly investment | Planning interpretation |
|---|---|---|
| 0% | $833 | Pure savings path. No market return help. |
| 3% | $716 | Conservative growth assumption. |
| 5% | $644 | Moderate long-term assumption. |
| 7% | $578 | More market-dependent. |
| 10% | $488 | Aggressive assumption that needs stress testing. |
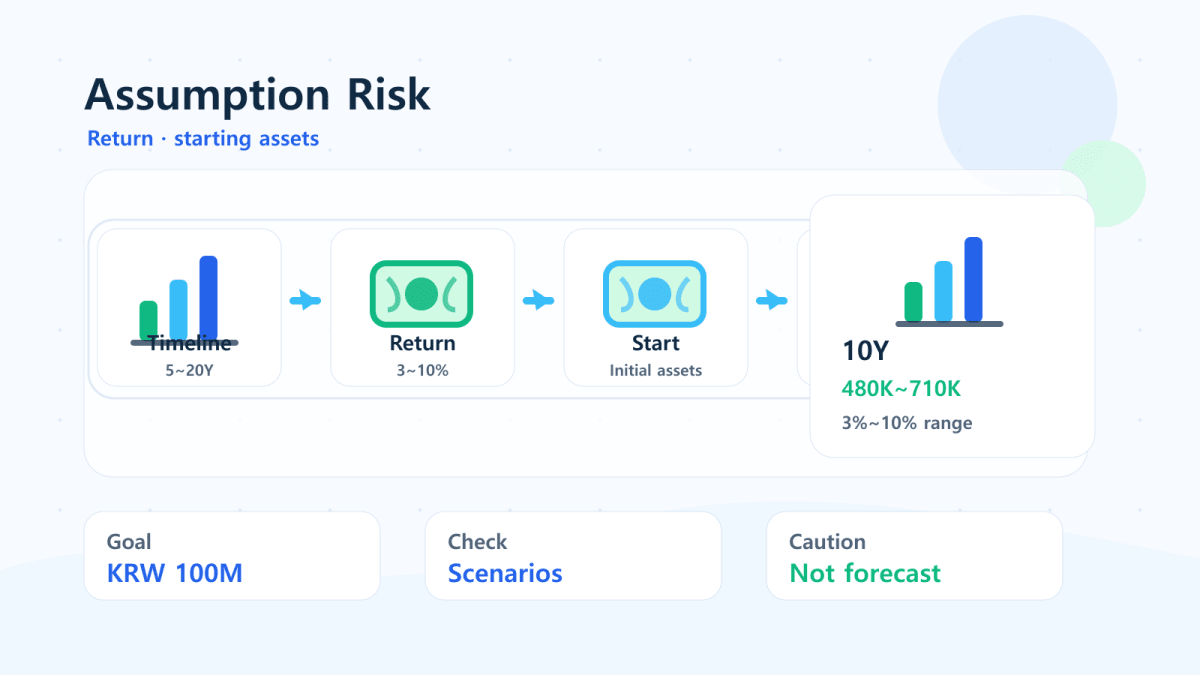
If your plan only works at the highest return assumption, the plan may be fragile. A more resilient plan checks what happens when returns are lower, inflation is higher, or contributions pause for a period.
For month-by-month investing paths, see the DCA Calculator. For future-value comparisons, use the Compound Interest Calculator.
KRW 100M Korea Example
The slug of this article comes from a Korean milestone: KRW 100 million. For English readers, it is best treated as a Korea example of the same target-portfolio problem.
Assumptions: KRW 100M target, KRW 0 starting balance, monthly contributions, no taxes or fees.
| Years | 3%/yr | 5%/yr | 7%/yr | 10%/yr |
|---|---|---|---|---|
| 5 | KRW 1.55M | KRW 1.47M | KRW 1.40M | KRW 1.29M |
| 10 | KRW 716K | KRW 644K | KRW 578K | KRW 488K |
| 15 | KRW 441K | KRW 374K | KRW 315K | KRW 241K |
| 20 | KRW 305K | KRW 243K | KRW 192K | KRW 132K |
The currency can change, but the planning structure is the same:
- Define the target.
- Choose the timeline.
- Enter current assets.
- Test multiple return assumptions.
- Convert the result into a monthly cash-flow plan.
What Changes the Required Monthly Investment?
| Input | If it increases | Effect on required monthly contribution |
|---|---|---|
| Target amount | Goal gets larger | Monthly amount rises. |
| Starting balance | You begin with more assets | Monthly amount falls. |
| Time horizon | You have more years | Monthly amount usually falls sharply. |
| Return assumption | Modeled return rises | Monthly amount falls, but uncertainty rises. |
| Taxes and fees | Costs increase | Monthly amount should rise. |
| Inflation | Real target gets larger | Monthly amount should rise. |
This is why a target portfolio calculator is more useful than a single table. The right answer depends on your own target, time horizon, currency, and assumptions.
Related Reading and Tools
Start with:
- Goal Simulator for target amount planning.
- DCA Calculator for monthly investing scenarios.
- Compound Interest Calculator for lump-sum and contribution compounding.
Useful next reads:
- General target portfolio monthly investing guide
- What Happens If You Invest $500 a Month for 10 Years?
- DCA vs Lump Sum: When Results Differ
Bottom Line
This page is a contribution-table reference, not a complete personal plan. Use the $100,000 and KRW 100M rows for orientation, then test your own target, starting balance, taxes, fees, and contribution timing in the Goal Simulator or DCA Calculator before treating the result as a real plan.
FAQ
What does this monthly contribution table show?
It shows estimated monthly contributions for a $100,000 target and a KRW 100M Korea goal under different timelines and return assumptions. It is a reference table, not a personalized plan.
Is a $100,000 target different from a KRW 100M target?
The currency is different, but the planning logic is the same. Define the target, choose a timeline, set assumptions, and calculate the required monthly contribution.
Should I use 7% or 10% as my expected return?
Use scenarios instead of one number. A plan that only works at 10% may be too fragile, so test lower return assumptions as well.
Do taxes and fees matter in a monthly investment calculator?
Yes. Taxes, fund fees, platform costs, and inflation can all raise the required contribution compared with a simplified table.
Which FinMap calculator should I use first?
Use the Goal Simulator if you know the target amount. Use the DCA Calculator if you want to model recurring investments and compare contribution paths.