Personal Finance
Personal finance topics that turn your money life into a plan.
- Cashflow, saving, and debt—summarized into one system.
- Plug leaks: taxes, insurance, and fees first.
- Connect goals to numbers and routines.
Featured posts
 2026-06-036 min read
What Falling Korean Apartment Transaction Volume Means
Learn how to read falling apartment transaction volume in Korea. Compare monthly and year-over-year volume, median price, average price, and price distribution in the real estate dashboard.
 2026-06-037 min read
How to Read Korean Apartment Transaction Prices | Median Average Unit Price
Learn how to read Korean apartment transaction data using median price, average price, unit price, and transaction volume. Use the FinMap real estate dashboard without overreading one number.
 2026-06-037 min read
Large Apartment Complexes in Korea | Household Count Volume Unit Price
Learn how household count affects Korean apartment data interpretation. Compare large complexes and smaller premium complexes with volume, unit price, and price distribution.
 2026-06-027 min read
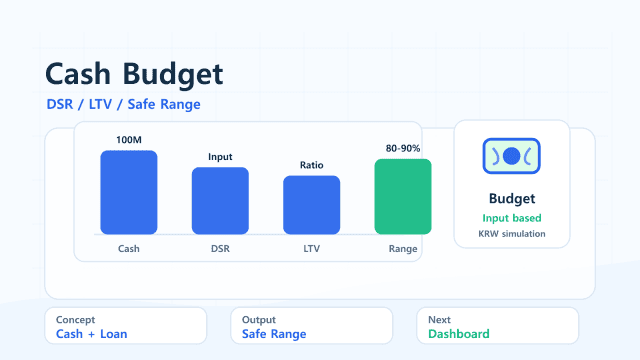
Cash KRW 100M 200M 300M Apartment Budget | Korea DSR LTV
Estimate what apartment budget KRW 100M, 200M, or 300M of cash can support under user-entered Korean DSR/LTV assumptions, then compare real transaction prices.
DSR/LTV Calculator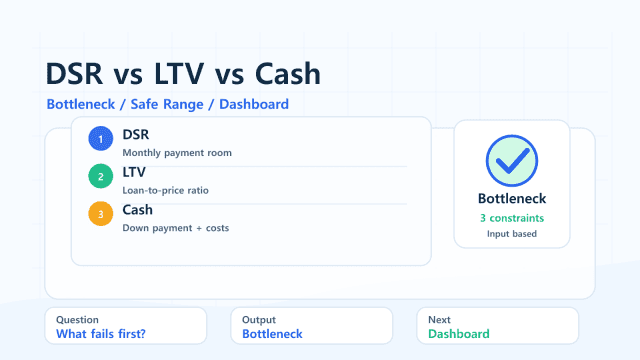 2026-06-027 min read
Passing DSR but Blocked by LTV Cash Costs | Korea Mortgage Check
Understand the difference between DSR, LTV, and cash bottlenecks in Korean mortgage simulations, with FinMap DSR/LTV sample inputs A-D.
DSR/LTV Calculator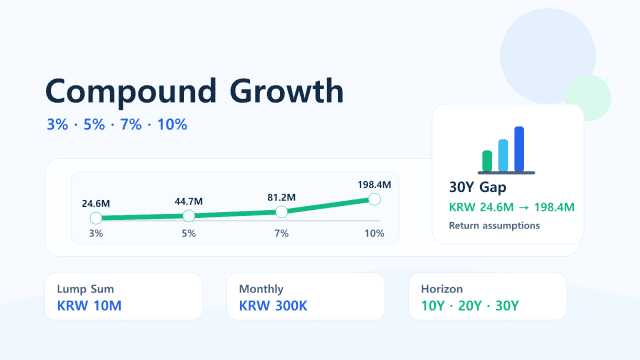 2026-06-016 min read
Compound Interest Table: 3%, 5%, 7%, 10% Over 10, 20, and 30 Years
Compare how annual return assumptions of 3%, 5%, 7%, and 10% change long-term compound growth for a lump sum and monthly investing plan.
Compound calculatorCAGR calculator
All post links (always included)(33 posts)
- 2026-06-036 min readWhat Falling Korean Apartment Transaction Volume Means
Learn how to read falling apartment transaction volume in Korea. Compare monthly and year-over-year volume, median price, average price, and price distribution in the real estate dashboard.
- 2026-06-037 min readHow to Read Korean Apartment Transaction Prices | Median Average Unit Price
Learn how to read Korean apartment transaction data using median price, average price, unit price, and transaction volume. Use the FinMap real estate dashboard without overreading one number.
- 2026-06-037 min readLarge Apartment Complexes in Korea | Household Count Volume Unit Price
Learn how household count affects Korean apartment data interpretation. Compare large complexes and smaller premium complexes with volume, unit price, and price distribution.
- 2026-06-027 min readCash KRW 100M 200M 300M Apartment Budget | Korea DSR LTV
Estimate what apartment budget KRW 100M, 200M, or 300M of cash can support under user-entered Korean DSR/LTV assumptions, then compare real transaction prices.
- 2026-06-027 min readPassing DSR but Blocked by LTV Cash Costs | Korea Mortgage Check
Understand the difference between DSR, LTV, and cash bottlenecks in Korean mortgage simulations, with FinMap DSR/LTV sample inputs A-D.
- 2026-06-016 min readCompound Interest Table: 3%, 5%, 7%, 10% Over 10, 20, and 30 Years
Compare how annual return assumptions of 3%, 5%, 7%, and 10% change long-term compound growth for a lump sum and monthly investing plan.
- 2026-06-016 min readKorea DSR 40% Rule Explained | Mortgage Borrowing Limit by Income
Learn how Korea's DSR 40% rule can limit mortgage borrowing capacity by income, interest rate, term, existing debt, and LTV.
- 2026-06-016 min read1pp Rate Increase and Korean Mortgage Capacity | DSR LTV Calculator
See how +1pp and +2pp rate scenarios affect Korean mortgage capacity, target home feasibility, and safer apartment search ranges.
- 2026-06-016 min readMonthly Contribution Table | $100,000 and KRW 100M Goal Examples
Use monthly contribution tables for a $100,000 target and KRW 100M goal, then compare timelines and return assumptions with FinMap calculators.
- 2026-05-285 min readDCA vs Lump Sum: When Do the Results Differ?
Compare dollar-cost averaging and lump-sum investing under different return assumptions. Learn why rising markets, volatile markets, and timing can change the outcome.
- 2026-05-286 min readMonthly Investment Needed to Reach a Target Portfolio
The monthly investment needed depends on your current balance, target amount, timeline, expected return, fees, and taxes. Use the goal simulator to compare required contributions without treating the result as a guaranteed return.
- 2026-05-286 min readIs Dollar-Cost Averaging Better in a Bear Market?
DCA is not automatically better in every bear market. Compare when dollar-cost averaging can reduce timing risk, when lump-sum investing can recover faster, and how drawdown timing changes the result.
- 2026-05-218 min readInvesting $500 a Month for 10 Years: DCA Calculator Example
See what $500 per month could become over 10 years under simple return assumptions, then test your own inputs with the DCA calculator and compound interest calculator.
- 2026-03-0916 min readDCA vs Lump Sum Without the Debate: A 3-Step Rule Based on Behavior Risk, Cash Buffers, and Time Horizon
Stop arguing about theoretical edge. Use a 3-step rule (survival → consistency → optimization) built on cash buffers, debt APR, time horizon, income stability, and behavior tolerance—then stress-test your choice in dca-calculator.
- 2026-02-0415 min readThe First 5 Years of Retirement Decide FIRE: Sequence-of-Returns Risk, Withdrawal Rules, and a 10-Minute Stress Test
Why the first five years around retirement are the most fragile: sequence-of-returns risk, inflation-adjusted withdrawals, guardrails, and a practical stress-test workflow using the FinMap FIRE calculator.
- 2026-02-0415 min readRetirement spending should be split into Essential / Lifestyle / Insurance (risk costs): build buffers and validate with the FIRE calculator
A stable retirement plan isn’t built from one spending number. Split spending into Essential, Lifestyle, and Insurance (risk costs), attach control levers and failure signals, and stress-test your buffers with the FIRE calculator.
- 2026-02-0318 min readFIRE Is Just 3 Numbers: Annual Spending, Retirement Horizon, and Withdrawal Rate (Then Validate in 10 Minutes)
FIRE planning becomes simple when you lock in three numbers: annual spending, retirement horizon, and withdrawal rate. This guide gives a rules-based framework (not stock picks) and shows how to validate your target with the FinMap FIRE calculator using 401(k)/IRA/Social Security and inflation-adjusted spending—plus sequence-of-returns guardrails.
- 2026-02-0315 min readThe 7 Most Common FIRE Modeling Mistakes: Fix Your Return, Inflation, and Tax Assumptions (Then Run Sensitivity Checks)
FIRE models usually don’t fail because the calculator is wrong—they fail because the assumptions are too optimistic. This guide shows the 7 most common modeling mistakes (returns, inflation, taxes, cash flows, and more), how to downshift inputs to reality, and how to run a 10-minute sensitivity check with the FIRE calculator.
- 2026-02-0116 min readRent vs Jeonse vs Buy: Not “Cheaper,” but “Safer” — Compare Cash Flow, Opportunity Cost, and Risk Triggers
In Korea, the best housing choice is rarely the cheapest on paper—it’s the one that keeps your plan intact when rates, deposits, or prices move. Use a dashboard-anchored price band to compare monthly cash flow, opportunity cost, and risk triggers across rent, jeonse, and buying.
- 2026-01-316 min readKorean Apartment Mortgage Risk Checklist | DSR LTV Rate Cash Buffer
Loan capacity and household affordability are different. Use the DSR/LTV calculator and real estate dashboard to check target home feasibility, rate shocks, and KRW transaction prices.
- 2026-01-2913 min readA 3-Step Home-Buying Roadmap Using Real Estate Transaction Data: Turn Anxiety Into Rules (Not Predictions)
Stop asking “Will prices go up?” and start asking “What can my budget, debt, and timeline support?” Using the Seoul–Gyeonggi–Incheon apartment real-transaction dashboard, this guide turns distribution, trend, and volume signals into a rules-based home goal plan for first-home buyers and upgraders.
- 2026-01-2715 min readStep-Up DCA: A Rulebook for Raising (or Pausing) Contributions Without Breaking Your Plan
A rules-based operating system for DCA: design a base contribution, add step-up and pause rules, and stress-test your plan with the DCA calculator—without relying on forecasts or product picks.
- 2026-01-2616 min readDCA Returns Are “Asset Return + Currency Return”: A Volatility Decomposition Framework That Reduces Panic and Rule-Drift
Global DCA often fails for a simple reason: you judge one number (USD return) even though two engines drive it—asset returns and currency returns. This US-first guide gives a decomposition framework you can apply in minutes, plus a rules-based operating plan (contributions, guardrails, rebalancing triggers) that prevents panic pauses and strategy drift. You’ll also stress-test assumptions using the FinMap DCA Calculator.
- 2026-01-1510 min readHigh-Rate Era: Should You Pay Down Debt or Invest First? (The Interest-Rate Threshold Rule)
In a high-rate environment, “always pay debt first” and “always invest first” are both incomplete. The practical answer is a rules-based threshold: treat debt payoff as a risk-free return, then compare it to realistic after-tax, after-fee, behavior-adjusted investing returns. This guide gives a simple 3% / 6% / 9% rule, a paycheck allocation plan you can stick to, and a decision framework that reduces anxiety without relying on market predictions.
- 2026-01-1410 min readYour Emergency Fund Isn’t a ‘Months’ Number — It’s a Risk Number (Job, Family, Debt)
Emergency funds fail when they’re sized by a generic ‘3–6 months.’ Build a risk-based target using job stability, dependents, and debt interest—and store it in tiers that survive real-world shocks.
- 2026-01-109 min readHousehold Survival in an Inflation Era: Cut Fixed Costs, Control Spending, and Protect Cash Flow
Inflation doesn’t just raise prices—it destabilizes household cash flow. This guide shows how to restructure fixed costs, run a cap-based budget, build an emergency fund, and keep your plan stable even when rates rise.
- 2025-11-266 min readWhat Is CAGR? Annualized Return Formula, Example, and Calculator
Learn what CAGR means, how annualized return differs from simple return, and how to use a CAGR calculator to compare ETF and fund performance.
- 2025-11-235 min readAnnual vs Monthly Compounding: Which Grows Faster?
Monthly compounding can grow slightly faster than annual compounding at the same nominal rate. Compare examples by rate, time horizon, and contributions, and avoid double-counting APY or effective annual rates.
- 2025-11-207 min readHow Much Should You Invest Monthly to Reach $100,000? 5-, 10-, and 15-Year Plans
To reach $100,000 from $0 at a 5% assumed return, invest about $1,470 monthly for 5 years, $644 for 10, or $374 for 15. Compare scenarios.
- 2025-11-193 min readReach Your Target Amount Faster: Contribution, Return, or Time?
Compare monthly contribution, expected return, and time horizon to see what moves your target date fastest, then test the plan in the goal simulator.
- 2025-11-178 min readFirst Salary Budget Setup: 5 Steps for Young Professionals
Set up your first salary plan with five steps: budget, fixed costs, emergency fund, debt, monthly investing, and FinMap calculator workflows.
- 2025-11-1514 min readSimple vs Compound Interest: Monthly Investing Example
See how simple and compound interest diverge over time with monthly contribution examples, then test assumptions in the compound interest calculator.
- 2025-11-1310 min readThe Three Pillars of Personal Finance: Budgeting, Emergency Funds, and Long-Term Investing (A Practical Setup Guide)
Before chasing returns, stabilize cash flow. This premium guide shows how to set up a realistic budget, build an emergency fund, and start long-term investing—in the right order—with checklists, tables, and common pitfalls.