
- DCA spreads investment timing across many contributions.
- Lump-sum investing places the same planned principal into the market at the start of the comparison.
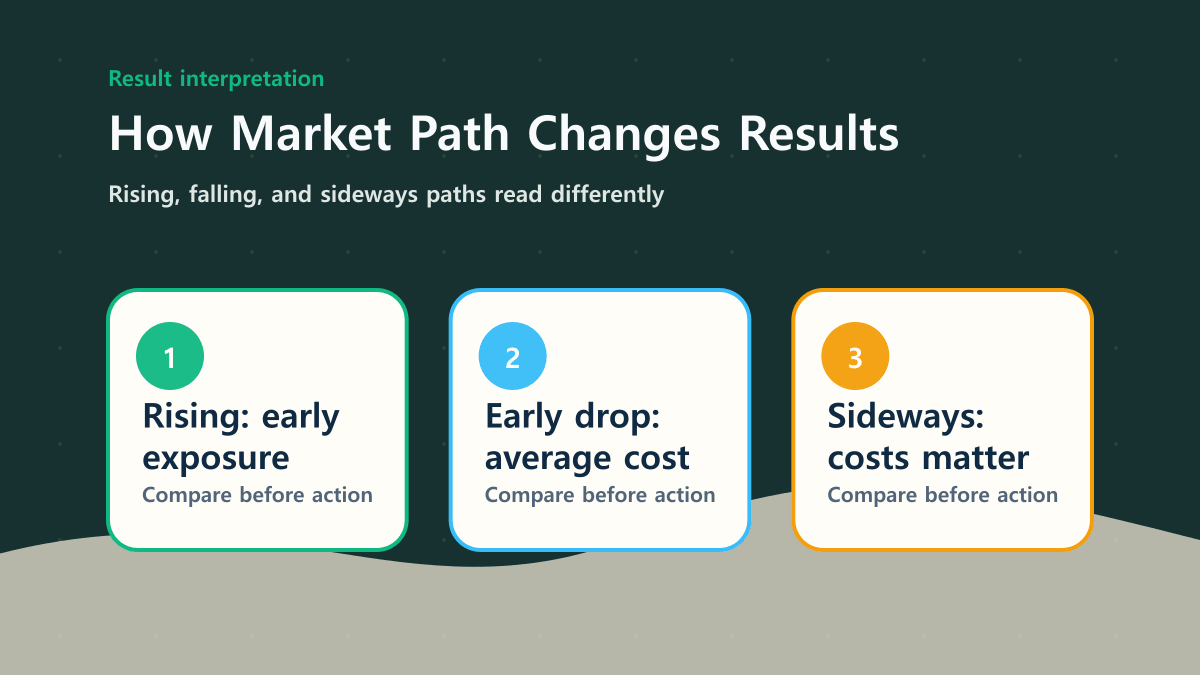
- In a steady rising path, the lump-sum result can look stronger because more money is exposed earlier.
- In an early decline and recovery path, DCA can benefit from adding money at lower prices.
- In a late decline, the final portfolio value can be hit hard regardless of the contribution method.
- The Finmap DCA Calculator compares DCA with a lump-sum case using the same planned contribution principal.
- Compare after-tax value, not just the pre-tax ending balance.
- The examples below are simulations based on assumptions, not market forecasts.
PERSONAL FINANCE · DCA VS LUMP SUM
DCA and lump-sum investing can produce different outcomes even when the total planned principal is the same.
The difference comes from timing. A rising path rewards earlier market exposure in the model, while a path with an early drawdown can make monthly contributions look more resilient.
This guide focuses on how to read the lump-sum comparison inside the Finmap DCA Calculator.
- Compare contribution timing, not just return assumptions
- Understand how market paths change the result
- Read the lump-sum comparison as a same-principal simulation
- Use after-tax value for the final comparison
Core idea
Same planned principal, different timing
The lump-sum comparison assumes the full planned DCA contribution amount is invested at the beginning.
The Basic Difference
DCA invests gradually. Lump-sum investing invests the comparison amount at the beginning. In the Finmap DCA Calculator, the lump-sum amount is the total planned DCA contribution, not the final DCA value.
| Item | DCA | Lump sum |
|---|---|---|
| Contribution timing | Spread across months | Invested at the start |
| Main sensitivity | Price path and consistency | Starting point and market exposure |
| Behavioral load | Lower single-date pressure | Higher timing pressure |
| Calculator comparison | Monthly contribution × period | Same planned principal invested upfront |
This makes the comparison easier to read: the principal is the same, but the exposure timing is different.

Why the Market Path Matters
A single annual return assumption can hide the order of returns. But DCA and lump sum are both sensitive to sequence.
| Market path | Why the result can differ | Planning note |
|---|---|---|
| Steady rise | More money is invested earlier in the lump-sum case. | Lump sum can look stronger in a smooth model. |
| Early drop then recovery | DCA adds money while prices are lower. | Average cost can improve in the simulation. |
| Mid-period drawdown | A larger accumulated balance is affected. | Look at both MDD and final value. |
| Final-year drop | The ending value is directly hit. | Goal timing becomes important. |
| Sideways market | Costs and taxes can become more visible. | Small differences may not be meaningful. |
Try changing the return assumption and period in the DCA Calculator, then compare the DCA result, lump-sum result, fees, taxes, and after-tax ending value.
Same Principal Example
Suppose you plan to invest 500 per month for 10 years. The planned principal is 60,000. The lump-sum comparison asks: what if that 60,000 had been invested at the beginning under the same return, tax, and fee assumptions?
| Item | DCA case | Lump-sum comparison | What it means |
|---|---|---|---|
| Planned principal | 60,000 | 60,000 | The principal is held constant. |
| Timing | 120 monthly contributions | One starting contribution | Exposure timing changes. |
| Final after-tax value | Calculated by inputs | Calculated by inputs | Compare the same after-tax basis. |
| Difference | Path-dependent | Path-dependent | The result is not a universal rule. |
If you want a broader decision framework, see DCA vs Lump Sum Decision Rules. For a simple monthly example, see What Happens If You Invest $500 a Month for 10 Years?. To isolate the compounding assumption, compare it with the Compound Interest Calculator.
A higher lump-sum result in one simulation does not mean lump sum is the right answer in every situation. Cash availability, risk tolerance, taxes, fees, and market volatility all matter.
What to Check in the Calculator
| Result field | Why it matters |
|---|---|
| DCA final after-tax value | Shows the gradual contribution case. |
| Lump-sum final after-tax value | Shows the same planned principal invested upfront. |
| Difference amount and rate | Shows how large the gap is under the assumptions. |
| Average cost and final price | Helps explain why DCA behaved differently. |
| Bear-market scenarios | Shows how timing of a drawdown can change the comparison. |

FAQ
Is DCA always better than lump sum?
No. The result depends on the market path, contribution timing, fees, taxes, and the investor’s ability to stay with the plan.
What principal does the lump-sum comparison use?
It uses the total planned DCA contribution amount and assumes that amount is invested at the beginning.
Why can lump sum look better in a rising market?
Because more money is exposed to the rising path earlier in the comparison.
Why can DCA help in a falling market?
DCA can add money at lower prices, which may lower the average cost in the simulation.
Should beginners choose DCA or lump sum?
There is no single answer. Cash availability, timeline, risk tolerance, and consistency all matter.