Korean apartment transaction data can look precise, but one number is rarely enough. A single average price can hide a luxury-unit sale. A recent low transaction can look dramatic even when the sample is tiny. A Top 100 list can favor large floor plans if you only read total price.
Transaction data should be read with context. Timing, floor area, floor level, transaction count, and sample size can all change the interpretation. This guide explains how to read median price, average price, unit price, and transaction volume before using the FinMap Real Estate Dashboard.
Quick Summary
- Median price is usually the cleaner starting point for a typical price band.
- Average price is useful, but it can be pulled by unusually high or low transactions.
- Unit price helps compare apartments with different floor areas.
- Transaction volume tells you how much confidence to place in the price signal.
- The same complex can show different prices by size, floor, building, and month.
- Top 100 lists should be read with unit price and volume, not total price alone.

Terms And Metrics
| Metric | Meaning | Best use | Watch out for |
|---|---|---|---|
| Average price | Arithmetic average of selected transactions | Quick market-level read | Sensitive to outliers |
| Median price | Middle value in the selected transaction set | Typical price band | Still unstable when volume is very low |
| Unit price | Price adjusted by area | Comparing different sizes or complexes | Does not capture floor, view, renovation, or building quality |
| Transaction volume | Number of transactions in the selected period | Confidence and liquidity check | Low volume can exaggerate changes |
| Latest transaction | Most recent reported transaction | Recency check | One deal is not a full market signal |
Median vs. Average: Why They Can Diverge
Imagine five transactions in one apartment complex:
| Deal | Price |
|---|---|
| 1 | KRW 800M |
| 2 | KRW 810M |
| 3 | KRW 820M |
| 4 | KRW 830M |
| 5 | KRW 1.05B |
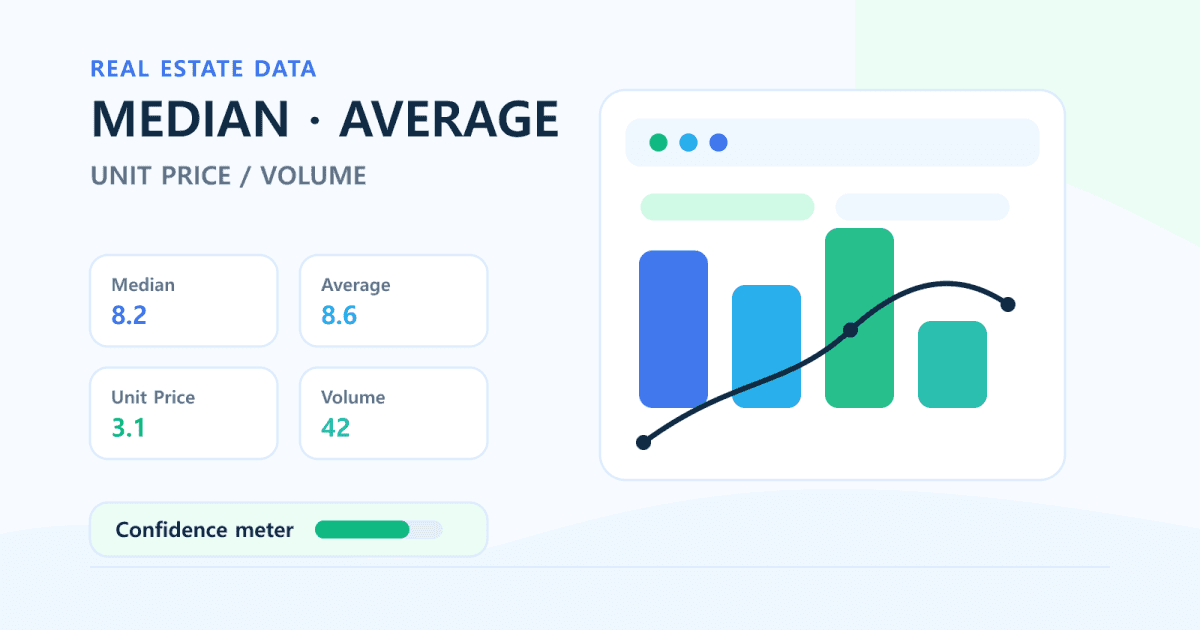
The median is KRW 820M. The average is KRW 862M because the high transaction pulls it upward.
That does not mean the average is useless. It means you should compare it against the median. If the average is far above the median, the dataset may include a larger unit, a better floor, a special building, or simply one unusual deal.

Why Unit Price Matters
Total price can be misleading when floor areas differ. A KRW 600M 59㎡ unit and a KRW 800M 84㎡ unit are not comparable by total price alone.
| View | Problem |
|---|---|
| Total price only | Larger apartments can look more expensive even when the per-area value is similar |
| Unit price | Helps normalize by floor area |
| Unit price plus volume | Helps compare value while checking whether enough deals exist |
This is especially important when reading Seoul Apartment Prices Top 100 style rankings. A total-price ranking can favor large units. Unit price and transaction volume reduce that bias.
Volume Is The Confidence Check
Transaction volume does not predict prices by itself. It tells you how much weight to place on the price number.
| Situation | Practical interpretation |
|---|---|
| High volume and rising median | Many deals may be supporting the move |
| Low volume and rising median | One or two high-priced deals may be driving the signal |
| High volume and flat prices | The price band may be holding with active liquidity |
| Low volume and falling prices | Check sample size before calling it a market break |
When volume is thin, expand the period, compare similar complexes, or check a broader region before drawing a conclusion.
Dashboard Reading Order
Open the Real Estate Dashboard
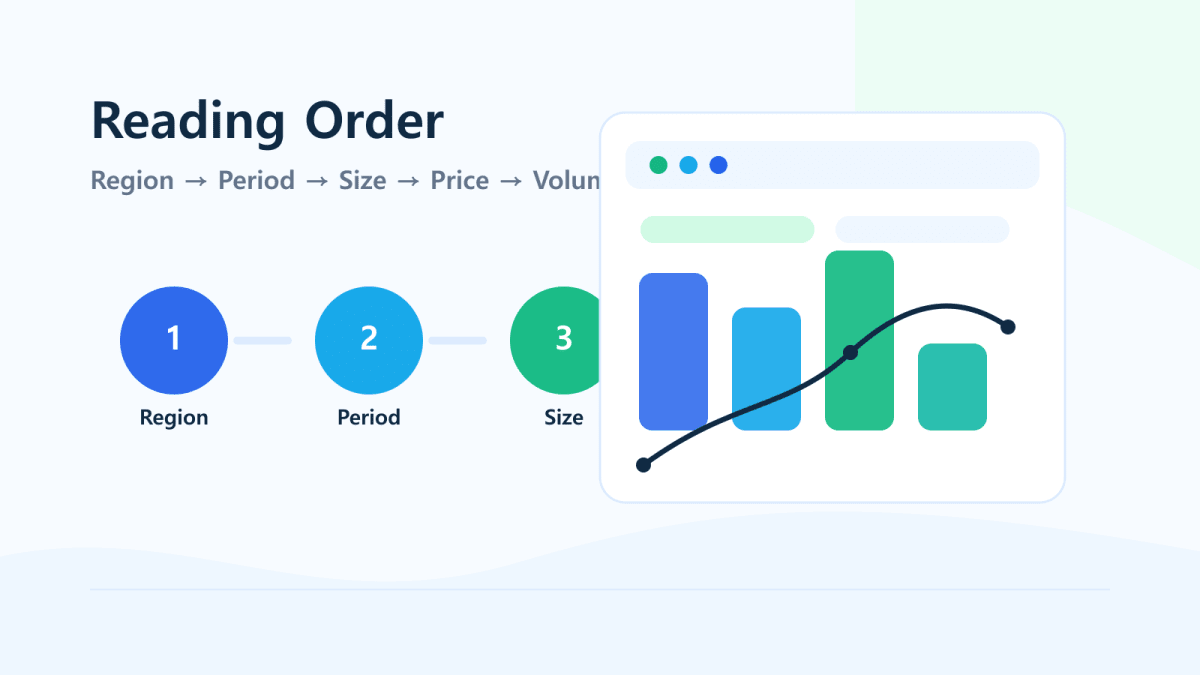
- Choose a region: Seoul, Gyeonggi, or Incheon.
- Select a period. If one month is too thin, compare three to six months.
- Match the size band before comparing prices.
- Start with typical price, or median.
- Compare average price against the median.
- Use typical unit price to normalize floor-area differences.
- Check transaction volume to judge confidence.
- Use Seoul Top 100 for a ranking view, and use the dashboard region filter for Gyeonggi and Incheon comparisons.
Interpretation Examples
Example 1: Average Is Much Higher Than Median
The selected transactions may include a larger unit, premium floor, renovated home, or a one-off high-priced deal. Do not treat the average as the normal price without checking the median and unit mix.
Example 2: Median Is Flat But Volume Falls
The price line may look stable, but the market may be less liquid. Read this as a confidence and liquidity signal first, not as a guaranteed price forecast.
Example 3: A Top 100 Complex Ranks High By Total Price
The complex may have larger units. Check unit price and volume before deciding that it is more expensive than another complex on a comparable basis.
Cautions
- Korean transaction data can lag the actual contract date.
- The same complex can vary by floor area, floor level, building, view, renovation status, and timing.
- When transaction volume is low, both average and median can move sharply.
- Top 100 rankings can create total-price bias.
- This article explains data interpretation. It is not a price forecast, investment advice, or lender guidance.
Related Links
- South Korea Apartment Transaction Dashboard
- Seoul Apartment Prices Top 100
- Gangnam Apartment Prices Top 100
- A 3-Step Home-Buying Roadmap Using Real Estate Transaction Data
- DSR/LTV Apartment Affordability Calculator
Bottom Line
Do not read Korean apartment data as one headline number. Start with median price, compare average price, normalize with unit price, and use volume as the confidence check.
Open the FinMap Real Estate Dashboard, choose a region and size band, then read median, average, unit price, and volume together. That routine is more useful than chasing one dramatic transaction.
FAQ
Should I start with median or average price?
Start with median price when you want the typical price band. Then compare the average to see whether outliers are pulling the result.
Why does unit price matter in Korean apartment data?
Total price does not adjust for floor area. Unit price helps compare different apartment sizes and reduces total-price bias.
Does low transaction volume make the data useless?
No. It means you should be cautious. Expand the period, compare nearby complexes, and avoid treating one or two deals as the whole market.
How should I read Top 100 rankings?
Use total price as a starting point only. Then check unit price and transaction volume because large units can dominate total-price rankings.
Can transaction data predict future apartment prices?
No. Transaction data shows reported deals. Timing, floor area, floor level, volume, and sample size can change the interpretation.