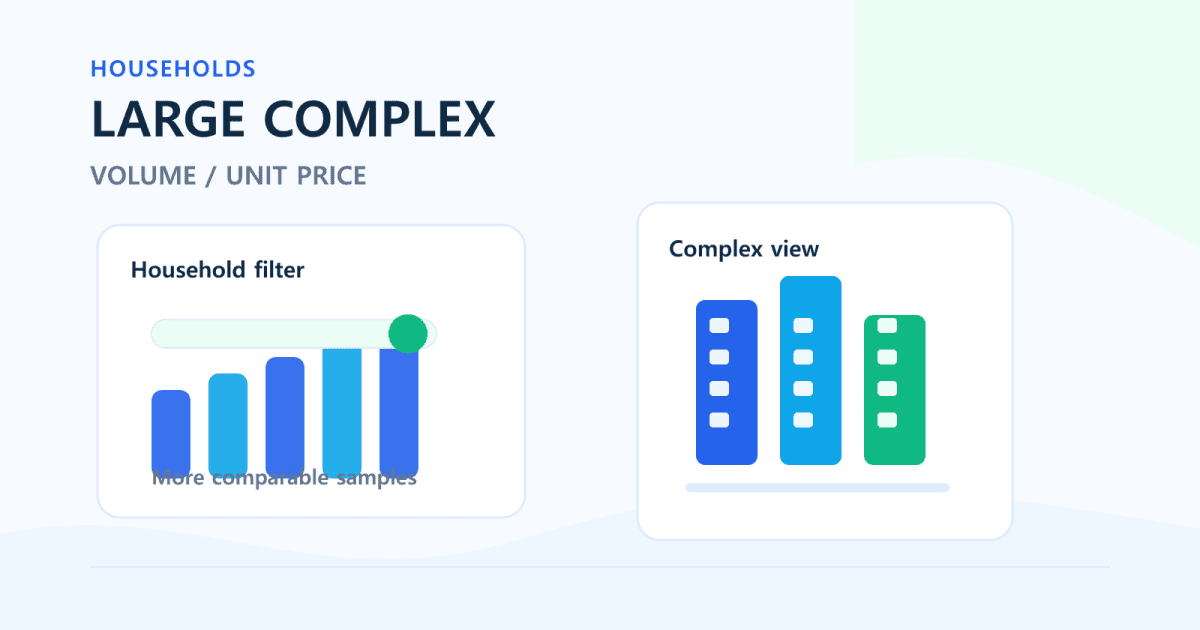
Large Korean apartment complexes often feel more “stable” because they have more households, more comparable units, and often more everyday infrastructure. That intuition can be useful, but it is not enough. A large complex can still contain very different buildings, floors, sizes, views, and renovation conditions.
Transaction data can change by timing, floor area, floor level, transaction volume, and sample size. Household count is a starting point, not a conclusion. Use it together with transaction volume, unit price, and distribution in the FinMap Real Estate Dashboard.
Quick Summary
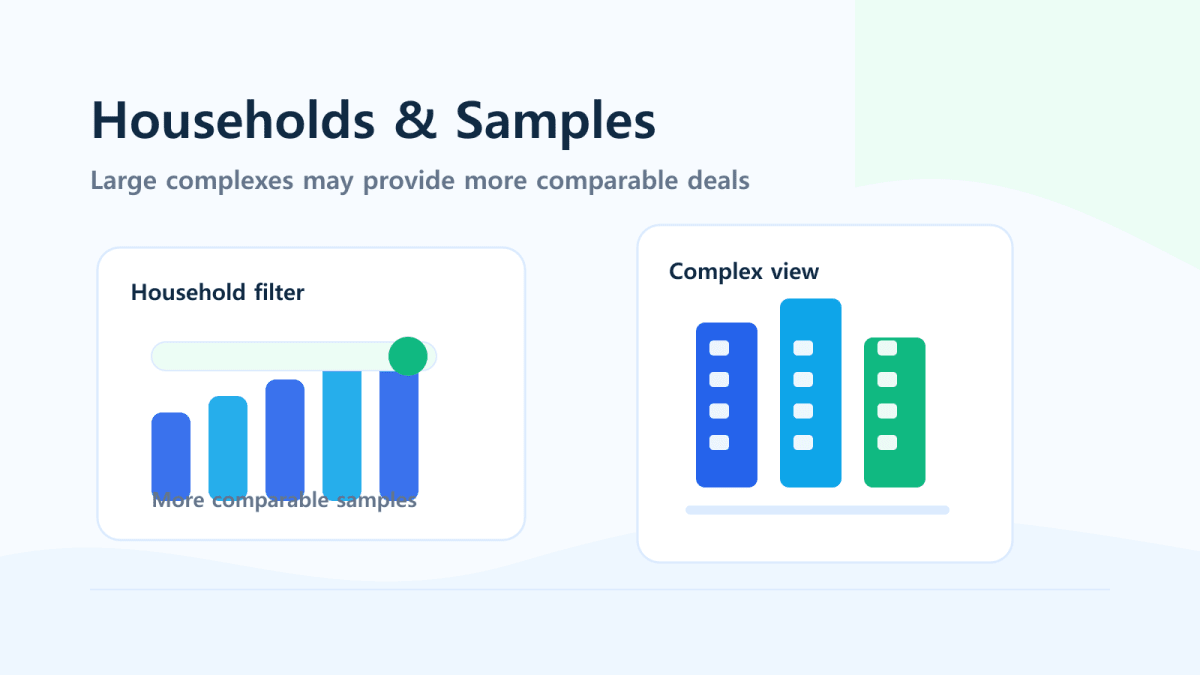
- More households can mean more transaction samples and better comparability.
- Large complexes may benefit from infrastructure, broader demand, and easier benchmarking.
- But internal differences by building, floor, and size can mix price signals.
- Smaller premium complexes can show distorted averages when volume is low.
- Household count alone cannot define price stability.
- Use the household filter with volume, unit price, and price distribution.
Terms And Metrics
| Metric | Meaning | Role in reading large complexes |
|---|---|---|
| Household count | Number of homes in the complex | Clue for sample depth and community scale |
| Transaction volume | Number of deals in the selected period | Liquidity and confidence check |
| Typical unit price | Area-adjusted median-style price | Better comparison across sizes |
| Typical price | Representative total price | Typical transaction band |
| Price distribution | Where deals cluster | Shows whether internal price bands are wide |
| Latest transaction | Most recent reported deal | Recency check, not a full signal |
How Household Count Affects Samples And Liquidity
A larger complex has more units that can trade. That can create more comparable transactions and make median and unit-price signals less dependent on one unusual deal.
But the key word is “can.” A 2,000-household complex with low recent volume still needs caution. Check whether transactions are actually happening in the selected period and size band.
Why Large Complexes Can Be Easier To Read
| Advantage | Why it matters | Dashboard check |
|---|---|---|
| More samples | More deals can reduce one-deal distortion | Transaction volume |
| Everyday infrastructure | Schools, shops, transit, and services may be easier to evaluate | Location and region |
| Broader demand | More buyer types may consider the complex | Volume persistence |
| Comparability | Similar units may trade repeatedly | Size filter and typical price |
The advantage is not a guaranteed price outcome. It is better data comparability.
The Illusion Inside Large Complexes
Large complexes are not uniform. Prices can vary because of:
- Size bands such as 59㎡, 84㎡, and 101㎡
- Low, middle, and high floors
- Building location within the complex
- View, noise, sunlight, and access to transit or school
- Renovation status and transaction timing
That is why a single average price can be misleading. Narrow the size band and compare typical unit price with volume.

Why Smaller Premium Complexes Can Distort Averages
Smaller high-end complexes can be excellent properties, but they often have fewer transactions. One deal can move the average sharply.
| Situation | Practical interpretation |
|---|---|
| One high-priced sale in a small complex | Average can jump dramatically |
| One low-priced sale in a small complex | It can look like a sudden drop |
| Zero or one transaction | Compare nearby similar complexes and widen the period |
| Low volume and volatile unit price | Treat the signal as low confidence |
Small does not mean bad. It means the data sample may be thinner.
Dashboard Reading Order
Open the Real Estate Dashboard
- Choose your region.
- Match the size band first.
- Use the advanced household-count filter.
- Sort or scan by transaction volume.
- Compare typical price and average price.
- Use typical unit price to normalize area differences.
- Compare large and smaller complexes under the same region and size rules.
- Use Seoul Top 100 and Gangnam Top 100 when you want to see how total-price rankings can favor certain complex types.
Checklist: Large vs. Smaller Complexes
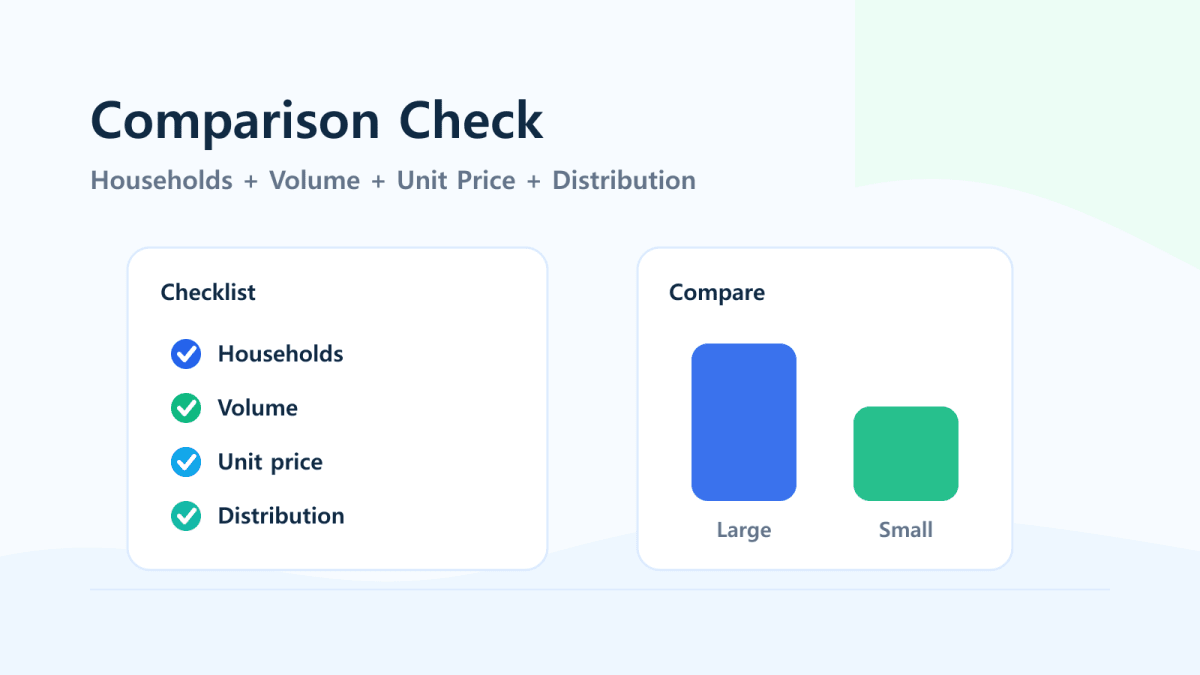
| Check | Large complex | Smaller complex |
|---|---|---|
| Transaction volume | Is the sample actually deep? | Is the sample too thin? |
| Size mix | Are different sizes mixed? | Is one size dominating? |
| Average vs. median | Is the internal range wide? | Is one deal distorting the metric? |
| Unit price | Compare with similar complexes | Separate premium characteristics |
| Latest deal | Use for recency | Do not overread it |
Interpretation Examples
Example 1: 2,000 Households, Strong Volume, Stable Unit Price
The representative price may be more reliable because many comparable transactions support the signal. Still check size and floor mix.
Example 2: 300-Household Premium Complex, One Expensive Deal
The average may jump. Compare unit price with nearby premium complexes and widen the time period.
Example 3: Large Complex, Falling Volume, Wider Distribution
The complex may be splitting internally. Preferred buildings or floors may hold up while less preferred areas weaken. Distribution matters more than the headline average.
Cautions
- More households do not guarantee price stability.
- Household count is a clue for sample depth and liquidity, not a final ranking.
- The same complex can vary by size, floor, building, timing, and condition.
- Smaller premium complexes can show distorted averages when volume is low.
- This article explains data interpretation, not price forecasting or investment advice.
Related Links
- South Korea Apartment Transaction Dashboard
- Seoul Apartment Prices Top 100
- Gangnam Apartment Prices Top 100
- Seoul vs Gyeonggi vs Incheon as a Risk-Budget Problem
- A 3-Step Home-Buying Roadmap Using Real Estate Transaction Data
Bottom Line
Household count is useful, but it is not the answer by itself. Large complexes often provide more comparable data, while smaller premium complexes can require extra caution because samples are thinner.
Use the FinMap Real Estate Dashboard to combine household count, transaction volume, typical unit price, and price distribution. That combination is much stronger than saying “large is safe” or “small is risky.”
FAQ
Are large apartment complexes always more stable?
No. They may provide more transaction samples and comparability, but internal differences by size, floor, building, and timing can still change the interpretation.
What is the biggest data advantage of a large complex?
More comparable transactions. If volume is active, median and unit-price signals can be less dependent on one unusual deal.
Why can smaller complexes show distorted averages?
Because fewer deals are available. One premium or discounted transaction can move the average sharply.
How should I use the household-count filter?
Use it with transaction volume, typical price, and unit price. Match the size band first so the comparison is fair.
What matters most when comparing large and smaller complexes?
Compare the same region and size band, then review transaction volume, unit price, and the gap between average and median.