- Home-buying becomes easier the moment you stop “forecasting prices” and start “defining rules” based on budget, debt capacity, and time.
- The dashboard is not a crystal ball—it’s a map of distribution, trend, and volume that helps you narrow choices without panic.
- Distribution tells you where you can realistically stand (lower band vs median vs upper band), not what the “average” headline says.
- Trend matters less than slope: a fast-moving market breaks plans via monthly payment pressure and down-payment drift.
- Volume is not automatically bullish—spikes can mean “chase risk,” while steady recovery can mean “base-building.”
- For first-home buyers, the win is a measurable target band and a repeatable savings rule, not “perfect timing.”
- For upgraders, the real risk is cashflow shock (overlap payments, deposit gaps), not the listing price alone.
- One good rule beats ten headlines: decide in advance when you wait, when you act, and when you pause.
- This post gives a 3-step roadmap plus checklists and triggers so you can run a weekly routine from real data.
WEALTH · HOME GOAL
“Prices feel high. Should we buy now or wait?”
That question is costly because it asks for a prediction—when what you actually need is a plan(budget, debt, timeline, rules) that still works under uncertainty.
This guide turns the Seoul–Gyeonggi–Incheon apartment dashboard into a rules-based goal system: distribution → financing → execution triggers.
- How to convert dashboard signals into a target price band(not one fragile number)
- How to translate “loan availability” into cashflow-safe debt rules
- How to avoid chasing spikes with wait/act/pause triggers you can repeat weekly
Scope/limits: No neighborhood picks, no apartment recommendations, no short-term price prediction. Focus is “data → interpretation → rules you can apply.”
What to read on the dashboard (mini-checklist)
- Distribution: price bands (median + upper/lower range) by area/complex
- Trend: the last 6–12 months(direction + slope)
- Volume & recovery signals: distinguish sharp rebound(chase risk) vs base-building(stabilization)
Open the dashboard here: South Korea Apartment Transaction Dashboard

Step 0: Replace “market questions” with “my questions”
Most home-buying anxiety comes from asking a market question as if it were your question.
- Market question: “Will Seoul prices rise this year?”
- Your question: “What price band can my budget, debt rules, and timeline support—without breaking cashflow?”
When you ask the right question, the dashboard becomes useful immediately.
Not because it predicts the future, but because it shows the current decision surface: where prices are clustered, how fast they’re moving, and whether transactions confirm the move.
One-line takeaway: If your question is “up or down,” you’ll feel stuck. If your question is “which band is feasible,” you can move.
Step 1: Use distribution to set a target band (not a single number)
A single target price is fragile. A target band is stable.
Why bands work:
- You can attach rules: “I only act inside this band.”
- You can update inputs (savings, rates, timeline) without emotional re-decisions.
- You stop anchoring on “average” headlines that hide huge dispersion.
How to read distribution like a buyer (not a commentator)
On the dashboard, distribution is your first filter:
- Lower band: “possible with discipline” zone (often more competition-sensitive)
- Median band: “most buyers fight here” zone (easy to chase)
- Upper band: “premium paid intentionally” zone (requires wide cashflow buffer)
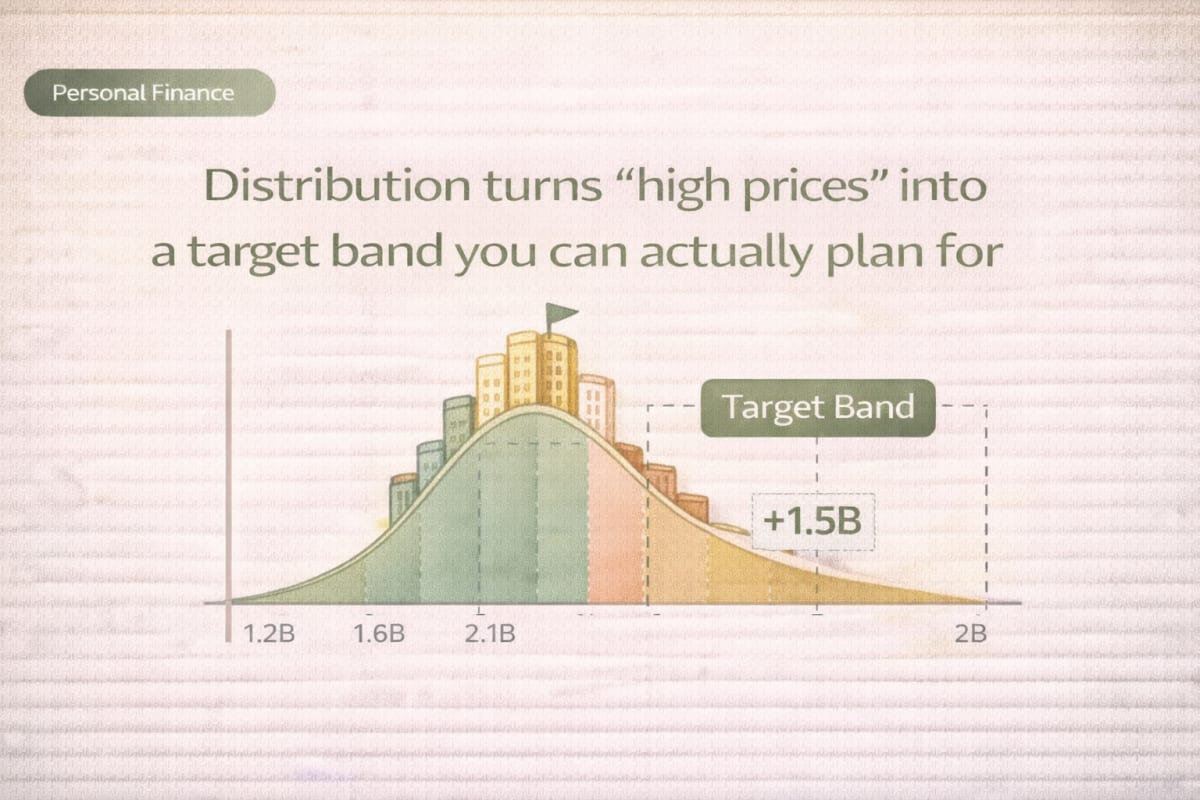
Table 1) Dashboard metric → interpretation → next action (required)
| Dashboard metric | Interpretation (what it really means) | Next action (rules-based) |
|---|---|---|
| Median + upper/lower range by area/complex | “Average” is misleading; distribution shows where you can realistically stand | Choose one band(lower/median/upper) as your target and list 10 candidate complexes |
| Dispersion across complexes in the same area | “Area” is too broad; complexity differs at the complex level | Keep the same 생활권, but rank complexes by band fit + transaction frequency |
| 6–12 month trend slope (speed) | Direction matters less than speed; fast slopes break savings/down-payment plans | If slope is steep, enforce a “no chase” rule and update savings/loan assumptions first |
| Volume spike + price spike | Could be recovery, but often sharp rebound(chase behavior) | Trigger a wait window(e.g., 2–4 weeks) and require confirmation before acting |
| Volume recovery + flat/slow prices | Often base-building (stabilization) | Move into “ready mode”: verify financing + documents + execution checklist |
| Low volume + stable prices | Signal reliability drops; price can be sticky/biased | Treat as low-confidence; widen band margin or deprioritize complex |
Interpretation (2–3 lines):
Distribution tells you “where your plan can stand.” Trend slope tells you “how quickly your plan can be invalidated.” Volume tells you “whether the move is confirmed or noise.”
If these signals conflict, your default action is wait, not “guess harder.”
Step 2: Convert “loan amount” into a cashflow rule
A dangerous mistake is treating debt capacity as a maximum loan headline.
For a household, debt capacity is a monthly cashflow rule that must survive surprise costs.
This is especially true for:
- First-home buyers with rising 생활비 and family plans
- Upgraders managing overlap payments (temporary double burden)
The cashflow-first framing (simple, but powerful)
You want to protect three buckets:
- Fixed costs: housing payment + essential bills
- Variable costs: lifestyle + education + transport
- Future costs: emergency fund + long-term investing
If housing payment expands until it squeezes future costs, the plan becomes fragile—even if the purchase “fits on paper.”

Table 2) Budget / debt / timeline → the rule you write down
| Input you control | What to calculate | Rule you write (example) | Why it reduces anxiety |
|---|---|---|---|
| Monthly surplus (after essentials) | Housing payment stress test | “If payment leaves no buffer, I lower the band.” | Converts fear into a boundary condition |
| Timeline (months) | Down-payment path | “If I can’t reach band down-payment in X months, I change band or extend timeline.” | Stops magical thinking |
| Rate uncertainty | Conservative payment scenario | “I plan with a higher-rate case, not the best-case rate.” | Avoids fragile approvals |
| Upgrader overlap risk | Temporary double-burden plan | “I only act if overlap costs are covered by a dedicated buffer.” | Protects family cashflow |
Interpretation (2–3 lines):
You don’t need perfect precision—you need rules that survive uncertainty.
If your rule is written, “rate headlines” become inputs, not triggers for panic.
This is how you replace anxiety with a system.
Misconception box (required): “If prices are high, the only smart move is to wait”
Why it’s wrong: Waiting without a plan is not a strategy—it’s a hope. If prices drift while you save without a defined band and debt rule, your target moves faster than your preparation, and anxiety increases. Also, an upgrader’s risk is often cashflow shock, not the purchase date.
Instead, confirm like this:
□ Do I have a target band tied to my timeline and savings rate?
□ Do I have a written wait/act/pause rule based on slope and volume?
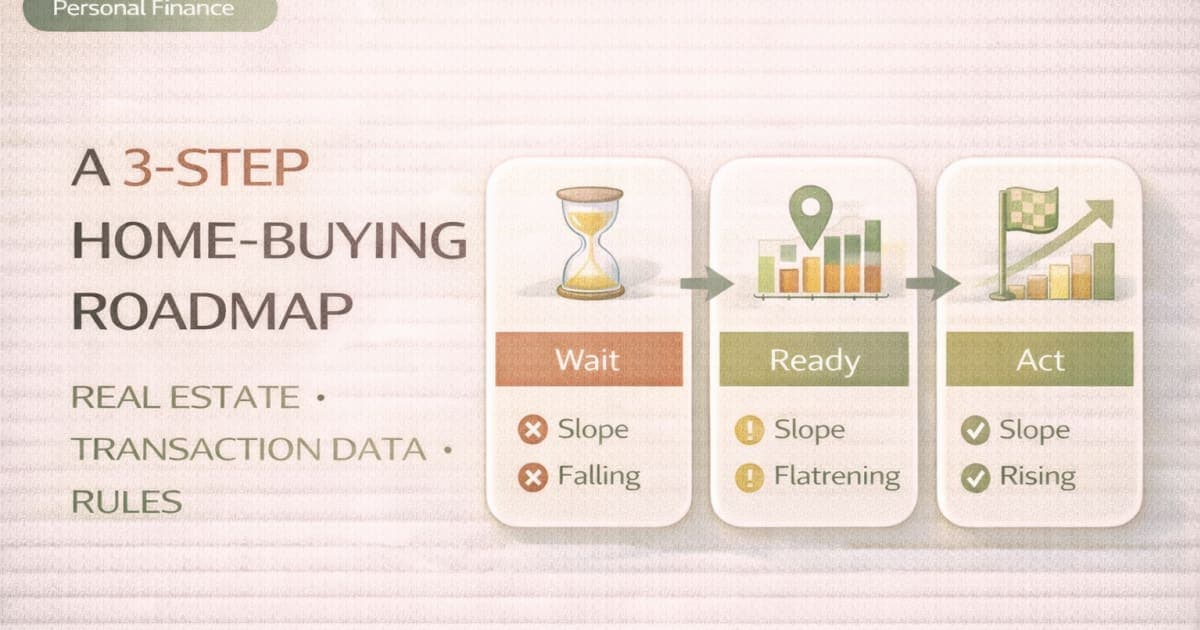
Step 3: Use trend + volume to define “wait / act / pause” triggers
This is the part most people skip. They look at charts and feel something.
But what you want is a state machine you can repeat.
Think in three states:
- Wait: signals conflict or look like sharp rebound (chase risk)
- Ready: stabilization + financing readiness
- Act: target band met + confirmation signals align
The dashboard recovery signals you’re actually looking for
- Sharp rebound: volume surges and price jumps quickly → high chance of chasing
- Base-building: volume normalizes gradually while price stabilizes → better setup for rules-based action

Table 3) Two scenarios: first-home vs upgrader (how rules change)
| Scenario | What “success” really means | Dashboard focus | Rules that prevent common mistakes |
|---|---|---|---|
| First-home (saving 18–24 months) | Reach a feasible band with stable cashflow | Distribution band + slope | “Steep slope = no chase; update band with savings rate.” |
| Upgrader (moving while owning) | Avoid overlap shock and forced timing | Volume signals + transaction frequency | “No action without overlap buffer; avoid low-volume complexes.” |
Interpretation (2–3 lines):
Same dashboard, different rules. First-home plans are won by a disciplined band + savings rule. Upgrader plans are won by cashflow protection and execution readiness.
If you follow the wrong rule set, you’ll feel “the market is unfair,” when it’s actually a mismatch of constraints.
One-line takeaway: Your plan should change when your constraints change—not when a headline changes.
A practical routine: 15 minutes / 60 minutes / one week
You don’t need to stare at charts daily. You need a cadence.
Checklist 1) “What to read on the dashboard” (weekly, 15 minutes)
- □ Open: South Korea Apartment Transaction Dashboard
- □ Confirm my target band (lower/median/upper) for my top 10 complexes
- □ Check 6–12 month slope: steep or manageable
- □ Check volume: sharp rebound vs base-building
- □ Decide state: Wait / Ready / Act(write it as one line)
Checklist 2) Cashflow safety check (monthly, 60 minutes)
- □ Housing payment stress-tested under conservative rates
- □ Emergency buffer exists (especially for upgraders)
- □ Savings rule still reaches down-payment within timeline
- □ “Pause condition” is written (what breaks the plan)
One-week action plan (to turn anxiety into a measurable goal)
- Pick 10 candidate complexes and assign your target band for each
- Write one debt rule (monthly payment boundary) and one pause rule
- Build a down-payment timeline (months) from your savings rate
- Run the dashboard weekly routine once and record your state
- Only after rules exist, start deeper home/complex due diligence
Turn the plan into a measurable goal (tools)
If you’ve defined a band and timeline, the next step is converting it into a monthly goal you can actually execute.
Related calculator: Open goal simulator
If you’re assuming investment returns inside your plan, keep the assumption realistic. A small change in CAGR can make a plan look “easy” on paper—and fragile in real life.
Related calculator: Open CAGR calculator
Mid-read A good piece of writing to read together: strengthen your rule system
These two pieces help you lock the “cashflow-first” mindset so the housing goal doesn’t break your overall wealth system.
- Build your money system around three pillars (cashflow, protection, growth)
- Set an emergency fund by risk (not by vague “months”)
End-game A good piece of writing to read together: make your plan faster and safer
If you want the home plan to move from “idea” to “execution,” these make the next steps concrete:
- Speed up a financial goal using three variables (principal, return, time)
- Reverse-calculate your monthly contribution from a target amount
- Use a threshold rule to decide: pay high-rate debt vs invest
FAQs (search-style)
How many times should I check the apartment dashboard
Weekly is enough for most households. The goal is to classify your state (wait/ready/act), not to react to every daily print. If you find yourself checking daily, it usually means you don’t have written rules yet.
Is volume always a bullish signal in real estate transactions
No. Volume spikes with price spikes can be a sharp rebound (high chase risk). Steady volume recovery with stable prices often looks more like base-building. Use volume as a “signal confidence” check, not as a buy signal.
What if my target band keeps moving upward as I save
That’s exactly why you need a band and a rule. If slope is steep, your rule should force a decision: raise savings, extend timeline, change band, or change candidate complexes. Waiting without adjustment is not a plan.
How do I avoid “chasing” during a sudden rebound
Use a wait window rule (e.g., 2–4 weeks) when you see volume spike + price spike. During the wait window, you only do financing readiness and due diligence—no impulsive offers based on fear of missing out.
First-home vs upgrader: what’s the biggest difference in planning
First-home planning is about reaching a feasible band with consistent savings. Upgrader planning is about surviving overlap cashflow shocks (temporary double burden, deposit gaps, timing friction). The same price can be “fine” for one and “dangerous” for the other.
Do I need to predict interest rates before buying
No. You need a conservative stress test and a boundary rule for monthly payment. Rates are an input; your rule is the system. If your plan requires the best-case rate to work, it’s fragile.
What’s the simplest rule I can write today
Write one sentence: “I act only inside my target band, and I pause when monthly payment leaves no buffer.”
It’s not perfect, but it immediately reduces headline-driven decisions.
Where should I start on the dashboard if I feel overwhelmed
Start with distribution. Pick your target band and list 10 candidate complexes. Only then look at slope and volume signals to decide your state. Open it here: South Korea Apartment Transaction Dashboard