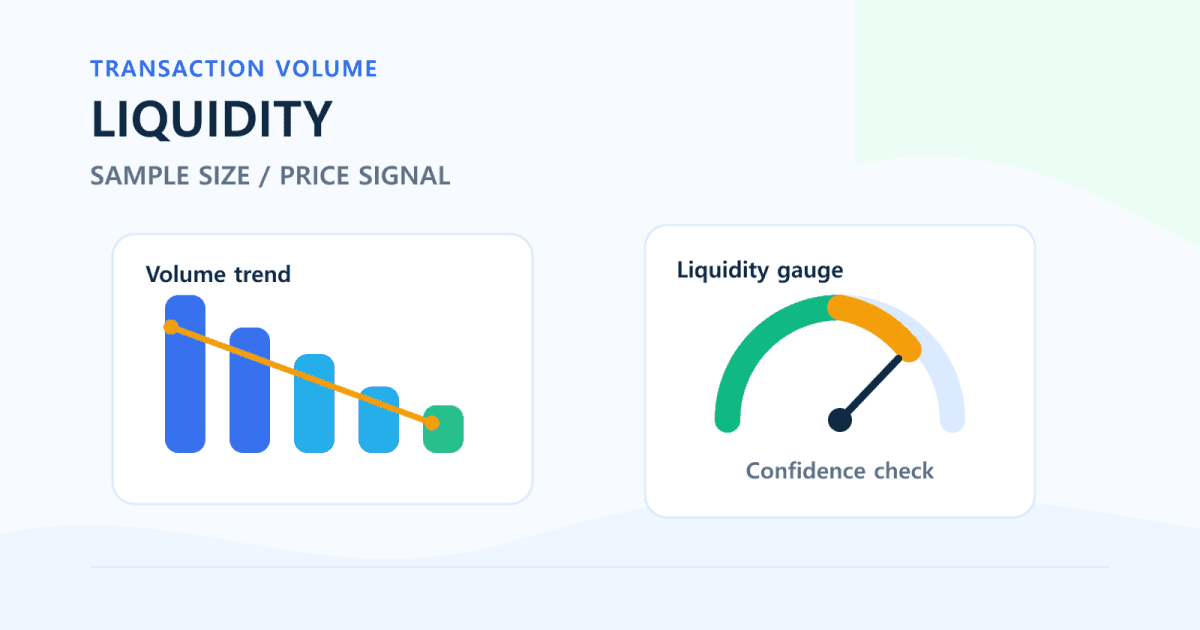
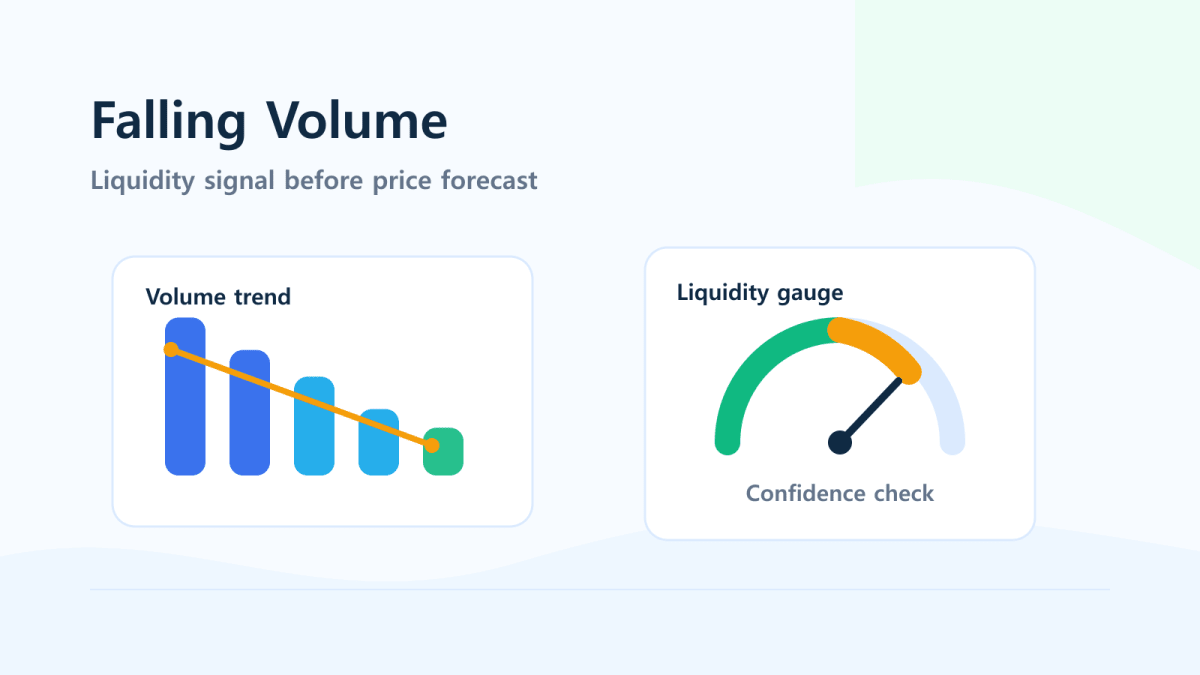
When Korean apartment transaction volume falls, the easy headline is “prices are about to fall.” That can happen, but volume is not a price forecast by itself. It is first a signal about liquidity, hesitation, bargaining friction, and sample quality.
Transaction data changes with timing, floor area, floor level, transaction volume, and sample size. Before drawing conclusions, use the FinMap Real Estate Dashboard to compare volume with median price, average price, unit price, and price distribution.
Quick Summary
- Transaction volume can freeze before prices visibly move.
- Falling volume does not automatically mean prices must fall.
- Low sample size can distort average and median prices.
- Region, size band, age, and price tier should be separated.
- Month-over-month changes are fast but noisy.
- Year-over-year changes reduce seasonality but can lag turning points.
- Read volume as a liquidity and confidence signal before treating it as a direction signal.
Terms And Metrics
| Metric | Meaning | Why it matters when volume falls |
|---|---|---|
| Transaction volume | Number of reported deals | Shows whether buyers and sellers are actually meeting |
| Month-over-month | This month versus previous month | Fast short-term temperature check |
| Year-over-year | This month versus same month last year | Helps reduce seasonality |
| Median price | Middle transaction value | Reduces some outlier noise |
| Average price | Arithmetic average | Reveals outlier sensitivity |
| Price distribution | Where deals cluster | Shows whether lower, middle, or upper bands are moving |
Four Ways To Interpret Falling Volume
1. Buyers And Sellers Cannot Agree On Price
Volume can decline before prices adjust. Buyers may wait for lower prices while sellers hold their asking levels. The result is fewer completed transactions, even if reported prices still look stable.
2. Households Are Waiting For Clarity
Rates, lending rules, taxes, income uncertainty, and jeonse-market conditions can all push people to wait. Falling volume may be a hesitation signal rather than a clean price signal.
3. Small Samples Make Price Metrics Noisy
If a month has only two transactions, one premium deal can lift the average. One low-floor or urgent sale can pull it down. In low-volume periods, both average and median prices require more caution.

4. The Market Splits By Region Or Segment
Seoul volume can fall while a specific district still trades. A large new complex can remain active while older smaller complexes freeze. Always separate region, size band, age, and price tier.
Month-Over-Month vs. Year-Over-Year
| Comparison | Strength | Weakness | Best use |
|---|---|---|---|
| Month-over-month | Detects short-term change quickly | Noisy, seasonal, affected by reporting delay | Market temperature |
| Year-over-year | Reduces seasonal distortion | Can lag turning points | Larger trend check |
| Three to six months | Smooths one-month noise | Can dilute sudden changes | Household decision context |
Do not treat one weak month as a complete story. Compare it with the same month last year and with a wider recent period.

Dashboard Reading Order
Open the Real Estate Dashboard
- Choose Seoul, Gyeonggi, or Incheon.
- Compare the latest month with the previous month.
- Compare the same month last year.
- Switch between all sizes and your target size band.
- Check transaction volume first.
- Compare median price and average price.
- Use unit price to normalize area differences.
- If volume is thin, widen the period to three to six months.
Interpretation Examples
Example 1: Volume Falls, Median Holds
The price band may look stable, but the confidence behind it is weaker. Treat this first as a liquidity signal.
Example 2: Volume Falls, Average Rises
A small number of high-priced deals may be pulling up the average. Check whether median price and unit price confirm the move.
Example 3: Volume Rises, Prices Fall
Some sellers may be accepting lower prices to complete deals. Segment the data before assuming the whole market is repricing.
Example 4: Volume Falls Only In One Segment
The issue may be concentrated in a specific size, location, or price tier. Broad averages can hide this split.
Cautions
- Falling volume is not a guaranteed price-decline signal.
- Volume is best read as liquidity, hesitation, and sample-confidence information.
- Low volume can distort both average and median prices.
- Reporting delays and seasonality can affect one-month readings.
- This article is about data interpretation, not a price forecast or investment recommendation.
Related Links
- South Korea Apartment Transaction Dashboard
- How Rates Transmit Into Korea Apartment Prices
- From Geopolitics to Korea Housing
- A 3-Step Home-Buying Roadmap Using Real Estate Transaction Data
Bottom Line
Falling transaction volume matters, but it should not be read as a one-line price forecast. Ask where volume is falling, whether median and average prices agree, and whether the sample is large enough to trust.
Use the FinMap Real Estate Dashboard to read volume, median price, unit price, and distribution together. Volume is the signal that tells you how much confidence to place in the price data.
FAQ
Does falling apartment transaction volume mean prices will fall?
Not necessarily. It can mean weaker liquidity, buyer-seller disagreement, or hesitation. Prices may move later, but volume alone is not a guarantee.
Can volume move before price?
Yes. When buyers and sellers cannot agree, completed deals can slow before reported prices visibly adjust.
Why are average and median less reliable when volume is low?
With only a few deals, one premium or distressed transaction can move the metric sharply.
Should I use month-over-month or year-over-year volume?
Use both. Month-over-month catches short-term changes quickly. Year-over-year helps reduce seasonal distortion.
What should I check first in the dashboard?
Start with transaction volume, then compare median price, average price, and unit price. If the sample is thin, widen the period.