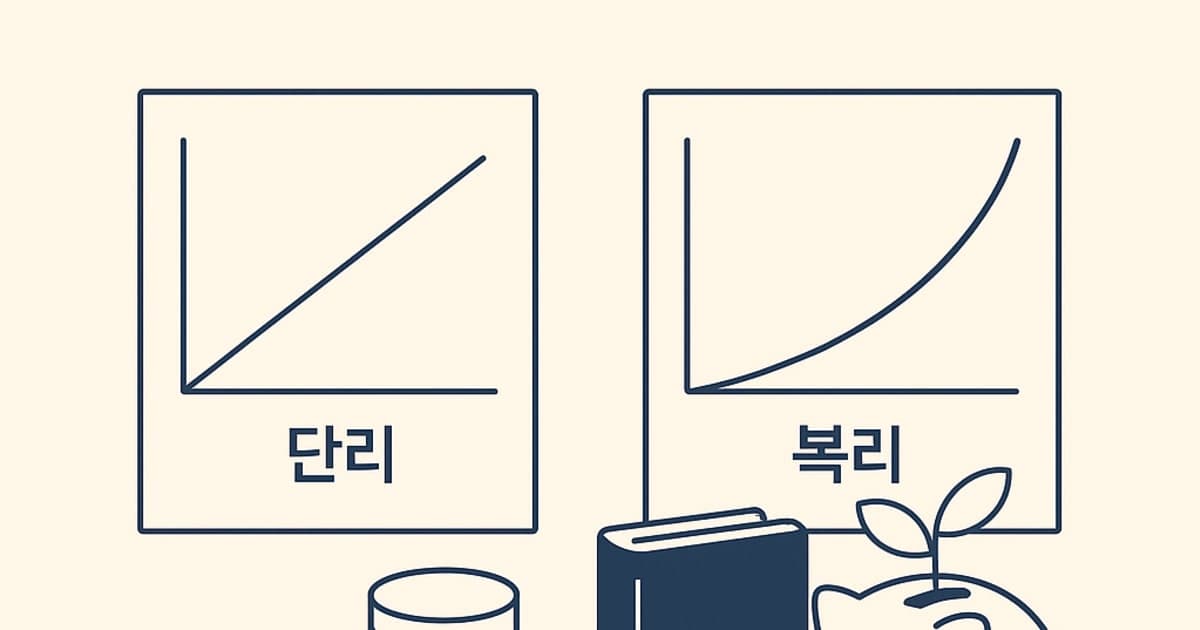
- Simple interest grows in a straight line; compound growth bends upward because the base you earn on keeps expanding.
- Compounding is not “automatic magic”; it only works when returns are reinvested and the plan doesn’t break.
- The most common beginner mistake is thinking compounding is a product label; in practice, compounding is a workflow.
- Gold-plated assumptions don’t matter if you pause contributions for long stretches; behavior and continuity often dominate spreadsheets.
- Inflation doesn’t “kill compounding,” but it changes the bar: your real goal is purchasing power growth, not just nominal dollars.
- Taxes and fees aren’t side notes; they are compounding “leaks” that can turn a good plan into a mediocre one over decades.
- Stocks and funds don’t pay “daily interest,” but they can still compound because business earnings reinvestment and reinvested distributions expand the base.
- If you remember one rule, make it this: optimize for a plan you can keep for 10–20 years, not a plan that looks perfect on a calculator.
- Use a simple scoreboard—rate, time, contribution, friction, and interruptions—to compare options without guessing the future.
PERSONAL FINANCE · COMPOUNDING
“If I earn 5% for 10 years, isn’t it basically the same either way?”
That intuition is expensive because simple interest and compounding are different money paths. The gap grows with time, and it grows even faster when you add monthly contributions.
This post gives you a framework + rules to spot where compounding truly happens, where it breaks (fees, taxes, pauses), and how to keep your plan intact.
- A clean mental model: linear vs compounding “base expansion” (not just formulas)
- Real-life examples in USD, including monthly contributions and inflation awareness
- A rules-based monitoring plan so compounding survives real life (not just spreadsheets)
Scope/limits: No stock/ETF picks and no performance predictions. This is finance basics + decision rules you can apply today.

Most beginner guides explain simple vs compound interest as two formulas—and stop there. That approach misses what actually determines outcomes: whether your money path keeps expanding or keeps getting reset.
So we’ll do something more practical:
- First, we’ll build a “money path” model you can remember.
- Then we’ll show where compounding shows up in savings and investing.
- Finally, we’ll convert it into a rules-based operating plan you can follow without forecasting.
The real difference is the shape of the path
Simple interest grows like a straight line because you only earn on the original principal.
Compound growth bends upward because you earn on a base that keeps getting larger: principal + past gains (and often new contributions).
Here are the two ideas in plain text:
Simple interest:
Interest = Principal × Rate × Time
Total = Principal + Interest
Compound growth: Total = Principal × (1 + Rate)^(Time)
The important part is not the symbols. The important part is what changes over time:
- In simple interest, the earning base stays fixed.
- In compounding, the earning base expands.

Table 1) Quick comparison: what changes, what doesn’t
| Feature | Simple interest | Compound growth |
|---|---|---|
| What you earn on | Original principal only | Principal + accumulated gains |
| Growth shape | Linear | Curved upward (accelerating) |
| Main driver | Rate × time | Time + reinvestment + continuity |
| Biggest risk | Inflation and missed opportunity | Leaks (fees/taxes) and interruptions |
Interpretation:
- If your plan is long-term, the key question is not “what rate,” it is how long the base can keep expanding.
- If you expect interruptions, compounding is not “automatic”; it depends on the rules you use to keep the plan alive.
The five variables that decide your compounding outcome
Beginners often treat compounding as one variable (“rate”). In practice, five variables decide what you actually keep.
- Starting principal (the starting base)
- Contribution (the fuel you add over time)
- Time horizon (how long the curve has to bend)
- Net return after friction (fees and taxes)
- Interruptions (pauses, withdrawals, and resets)
If you lock these five, you can compare almost any plan without guessing the future.
Table 2) The compounding “leaks” and the practical fixes
| Leak (what breaks compounding) | What it looks like in real life | Why it matters | Practical fix you can actually keep |
|---|---|---|---|
| Fees | high expense ratios, advisory drag, account costs | you compound the drag too | set a fee ceiling you won’t exceed |
| Taxes | frequent taxable distributions, short-term trading | reduces net reinvestment | focus on long-horizon turnover discipline |
| Interruptions | long pauses, panic selling, frequent withdrawals | destroys time and base expansion | define a “minimum contribution” rule |
| Inflation blind spot | measuring success only in nominal dollars | real purchasing power can stagnate | track goals in today’s dollars too |
| Over-optimization | constant tweaking, strategy hopping | plan breaks more often | limit changes to a quarterly or annual review |
Interpretation:
- A small recurring leak can beat a big “expected return” in the wrong direction because it compounds for years.
- The most valuable fix is often not “find a better return,” but reduce the probability your plan breaks.
Simple interest is not evil—just limited
Simple interest can be fine for short horizons or purpose-built cash goals where predictability matters more than growth. The problem is using simple interest logic for long-horizon wealth building.
Example: $1,000 at 5% for 10 years
Simple interest:
- Annual interest: $1,000 × 5% = $50
- Total interest: $50 × 10 = $500
- Total: $1,500
Compound growth (annual compounding):
- Total: $1,000 × (1.05)^10 ≈ $1,628
The difference looks modest at 10 years. The point is not the exact number; the point is the curve. The longer the horizon, the more the curve matters.
Table 3) Same rate, different horizons: why time changes everything (one-time deposit)
Assume a one-time $10,000 deposit at 5% (no fees/taxes modeled here; this is a clean math illustration).
| Horizon | Simple interest total | Compound growth total | Gap (compound minus simple) |
|---|---|---|---|
| 10 years | $15,000 | ≈ $16,289 | ≈ $1,289 |
| 20 years | $20,000 | ≈ $26,533 | ≈ $6,533 |
| 30 years | $25,000 | ≈ $43,219 | ≈ $18,219 |
Interpretation:
- The gap is not “extra interest,” it is the effect of earning on past gains.
- This is why compounding is a time story: the curve needs years to express itself.
Compounding in savings vs compounding in investing are not the same thing
A common beginner confusion is thinking compounding only exists in interest-bearing bank products. In reality, compounding can show up in different forms:
- In savings products: interest credited and reinvested expands your base.
- In investing: business earnings reinvestment, price appreciation, and reinvested distributions expand your base over time.
Important nuance:
- Stocks and ETFs don’t literally pay “daily interest.”
- But the wealth-building effect can still be compounding if gains remain invested and the plan stays intact.
If you want to go deeper on the “frequency” question (annual vs monthly compounding), use this mid-article guide:
And if you want a clean way to summarize growth in one line, this is the piece that makes compounding measurable:
Misconception box: “Gold-like fear events or market volatility automatically boosts compounding”
Misconception: “Compounding will take care of itself as long as markets go up eventually.”
Why it fails: Compounding is fragile when real life forces pauses, withdrawals, or panic exits. Many long-horizon plans fail because the contribution path breaks, not because the long-run average was ‘wrong.’
Instead, verify this:
1) Do you have a minimum contribution rule for stressful months?
2) Do you have a withdrawal rule that protects the base from frequent resets?
Two case studies: same income, different compounding outcomes
These scenarios are not predictions; they are pattern recognition. The goal is to show how rules can preserve compounding even when life changes.
Case study 1) The “cash-out interest” saver vs the “reinvest” saver
Both people keep $10,000 in a product that yields 4% annually.
- Saver A withdraws the interest each year and spends it.
- Saver B leaves the interest in place (reinvesting).
They see the same “rate,” but they run different systems:
- Saver A experiences something closer to simple-interest behavior.
- Saver B experiences compounding because the base expands.
The lesson is not moral. It is mechanical:
- If gains are not reinvested, the base does not expand.
- If the base does not expand, compounding cannot express itself.
Case study 2) The consistent contributor vs the frequent pauser
Both people aim to invest $300 per month over 10 years.
- Investor A keeps contributions stable, with a minimum rule in bad months.
- Investor B pauses for long stretches during stress, then “catches up later.”
Even if Investor B has the same total contributions on paper, the money path is different:
- Investor A gives early contributions more time to compound.
- Investor B repeatedly resets the curve by removing time from early dollars.
This is why the “best plan” is often the plan that is easier to keep.
A rules-based monitoring plan that protects compounding (weekly/monthly)
You do not need daily tracking to compound. You need the right cadence and triggers.
Use weekly checks for stability signals (so you don’t drift), and monthly checks for structure (so you don’t break).
Table 4) A simple dashboard: what to monitor and what to do
| Cadence | What to check | Trigger (observable) | Decision bias (add/hold/reduce) | Why it protects compounding |
|---|---|---|---|---|
| Weekly | Contribution continuity | You skipped a contribution | Hold (resume) | missing one month often becomes a pattern |
| Weekly | Cash buffer health | Buffer falls below your minimum | Reduce (temporarily) | preserves the base by preventing forced withdrawals |
| Monthly | Fee and friction check | Costs drift above your ceiling | Reduce friction | small drags compound for decades |
| Monthly | Plan simplicity | Too many changes this month | Hold (simplify) | fewer knobs = fewer breaks |
| Quarterly | Contribution step-up | Income rises or expenses fall sustainably | Add (step-up) | step-ups compound best when persistent |
Interpretation:
- “Add/hold/reduce” is not a market call; it is a compounding-quality call.
- The best trigger is usually cash-flow stability because the fastest way to destroy compounding is forced selling or frequent withdrawals.
Checklist 1) The 15-minute setup that makes compounding real
- □ Set a monthly auto-transfer date (treat it like a bill you pay yourself)
- □ Define a minimum contribution for stressful months (not zero)
- □ Create a fee ceiling you won’t exceed (write it down)
- □ Define a “no-withdrawal” bucket for long-horizon money
- □ Decide your review cadence (monthly) and stick to it
Checklist 2) The monthly review that prevents “plan decay”
- □ Did you contribute as planned this month? If not, what is the fix?
- □ Did you make an unplanned withdrawal? If yes, what rule prevents repeats?
- □ Are fees, taxes, or account choices adding friction you can reduce?
- □ Are you changing the strategy too often? If yes, limit changes to quarterly
- □ Is your goal still realistic given time and contribution? If not, adjust variables, not motivation
Use FinMap tools to convert “concept” into numbers
The point of compounding is not to admire a curve. It is to build a plan that matches your time horizon and monthly capacity.
Related calculator: Open compound interest calculator
This calculator helps you validate how principal, time, and return assumptions interact under compounding. Input: starting balance, time horizon, return assumption, and (if relevant) taxes/fees as friction.Related calculator: Open CAGR calculator
This calculator helps you convert a beginning value, ending value, and holding period into a comparable annualized return. Input: starting value, ending value, period, and friction assumptions; compare it with simple return so the result is not overstated.If you want the “next puzzle pieces,” read these in this order
- See how compounding frequency changes long-term results
- Turn total return into CAGR so performance is comparable
- Learn the 3-variable balance that speeds up goals (principal vs return vs time)
FAQs
1) Is simple interest ever “better” than compounding?
Simple interest can be appropriate for short-term goals where predictability matters more than growth. For long-horizon wealth building, compounding tends to be more aligned with how money actually grows. The key is matching the structure to the purpose.
2) When does compounding start to feel powerful?
Many people notice the curve after 7–10 years, and it becomes more obvious after 15–20 years. The “power” is mostly time, not a magical rate. If your plan keeps resetting, you may never feel the curve.
3) Do stocks and ETFs really “compound” if they don’t pay interest?
They can, depending on what happens to gains and distributions. Business earnings reinvestment and reinvested distributions can expand the base over time. The compounding effect depends on staying invested and limiting leaks.
4) What matters more: compounding frequency or contribution size?
For most beginners, contribution size and continuity matter more than frequency. Monthly compounding can help, but a plan that breaks is worse than a plan with slightly less frequent compounding. Optimize for a plan you can keep.
5) How do taxes and fees change compounding?
They reduce what gets reinvested, which reduces base expansion. A small annual drag can become a large long-term gap because the drag itself compounds. Treat taxes and fees as friction and monitor them regularly.
6) How should I think about inflation in a compounding plan?
Inflation raises the bar because the goal is purchasing power, not just nominal dollars. You don’t need perfect inflation forecasts; you need a conservative assumption and a habit of reviewing goals in “today’s dollars.” The practical step is comparing scenarios rather than trusting one number.
7) What is the biggest reason compounding fails for beginners?
Interruptions. Pauses, panic exits, and frequent withdrawals reset the curve and remove time from early dollars. A minimum contribution rule and a cash buffer rule prevent most breaks.
8) What’s the fastest way to improve my plan without changing investments?
Reduce friction and increase consistency. Lower avoidable fees, stop frequent strategy changes, and automate contributions on a schedule. Compounding rewards stability more reliably than optimization.