A 2 percentage point return gap can look small in a one-year conversation. Over 20 or 30 years, it can become the difference between a modest surplus and a completely different asset path. That is the quiet power, and risk, of compounding.
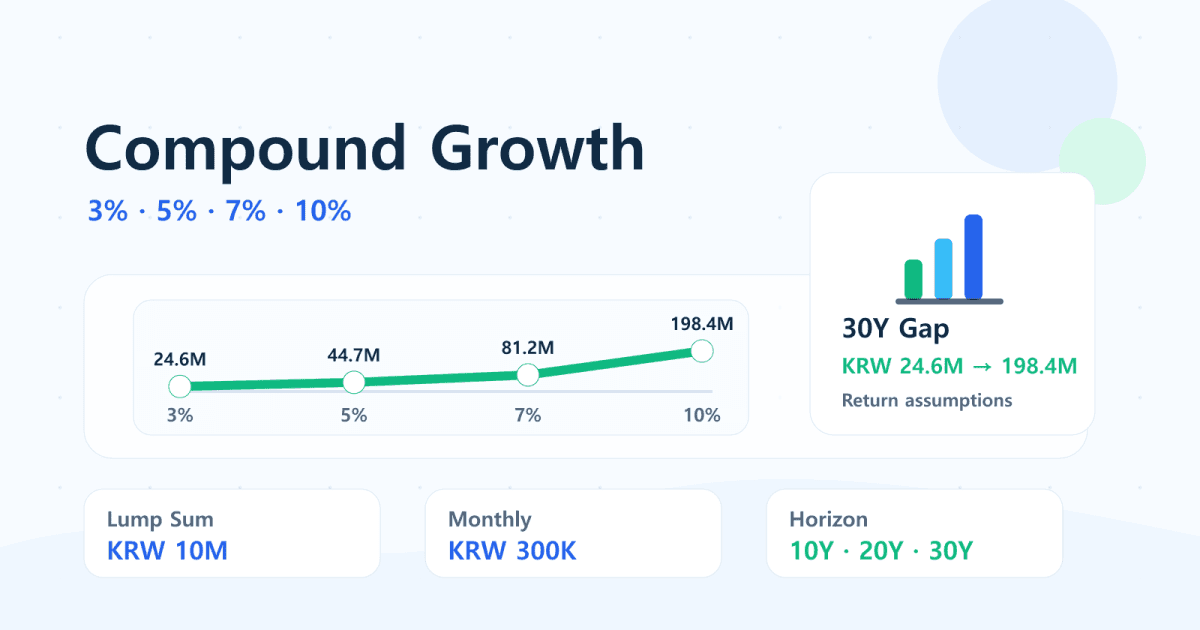
This page is designed as a citeable reference table. It compares 3%, 5%, 7%, and 10% annual return assumptions using two simple KRW examples: a KRW 10 million lump-sum investment and a KRW 300,000 monthly contribution plan. The figures are simulations, not forecasts or investment recommendations.
Quick Summary
- A KRW 10 million lump sum grows to about KRW 24.57 million at 3% over 30 years, but about KRW 198.37 million at 10%.
- KRW 300,000 per month for 30 years has KRW 108 million of total contributions.
- Under the same monthly contribution plan, the 30-year result is about KRW 174.82 million at 3% and KRW 678.15 million at 10%.
- The longer the timeline, the more a return assumption changes the final number.
- These tables assume no taxes, fees, inflation adjustment, or currency conversion.
- Real returns can be volatile and path-dependent; do not treat any row as a promised outcome.
Assumptions
| Item | Assumption |
|---|---|
| Lump-sum example | KRW 10 million initial amount, no additional contributions |
| Monthly example | KRW 0 initial amount, KRW 300,000 per month |
| Return assumptions | 3%, 5%, 7%, and 10% per year |
| Time horizons | 10, 20, and 30 years |
| Compounding | Monthly compounding |
| Taxes, fees, inflation | 0% for comparison only |
KRW is the Korean won. The point of the table is not the currency itself, but the compounding relationship between contribution, return, and time.
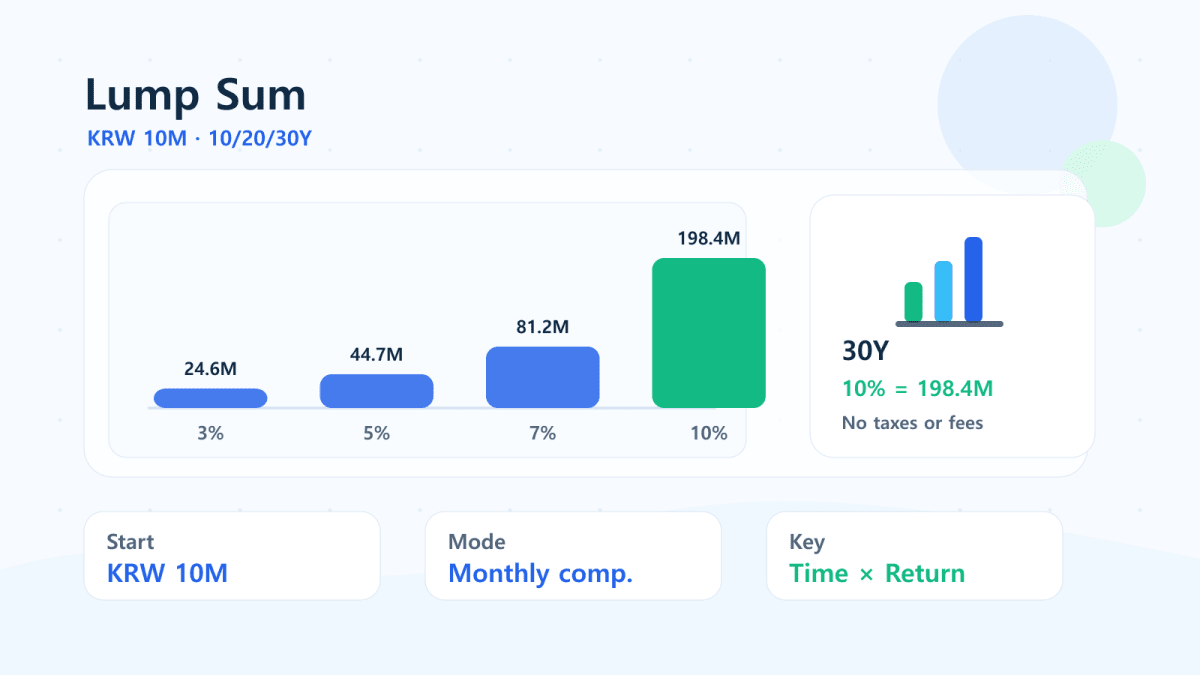
Table A. KRW 10 Million Lump Sum
| Horizon | 3%/yr | 5%/yr | 7%/yr | 10%/yr |
|---|---|---|---|---|
| 10 years | KRW 13.49M | KRW 16.47M | KRW 20.10M | KRW 27.07M |
| 20 years | KRW 18.21M | KRW 27.13M | KRW 40.39M | KRW 73.28M |
| 30 years | KRW 24.57M | KRW 44.68M | KRW 81.16M | KRW 198.37M |
In the 10-year row, 3% and 10% already diverge meaningfully. In the 30-year row, the gap becomes the main story. That does not mean 10% is a reliable planning input; it means the assumption deserves stress testing.
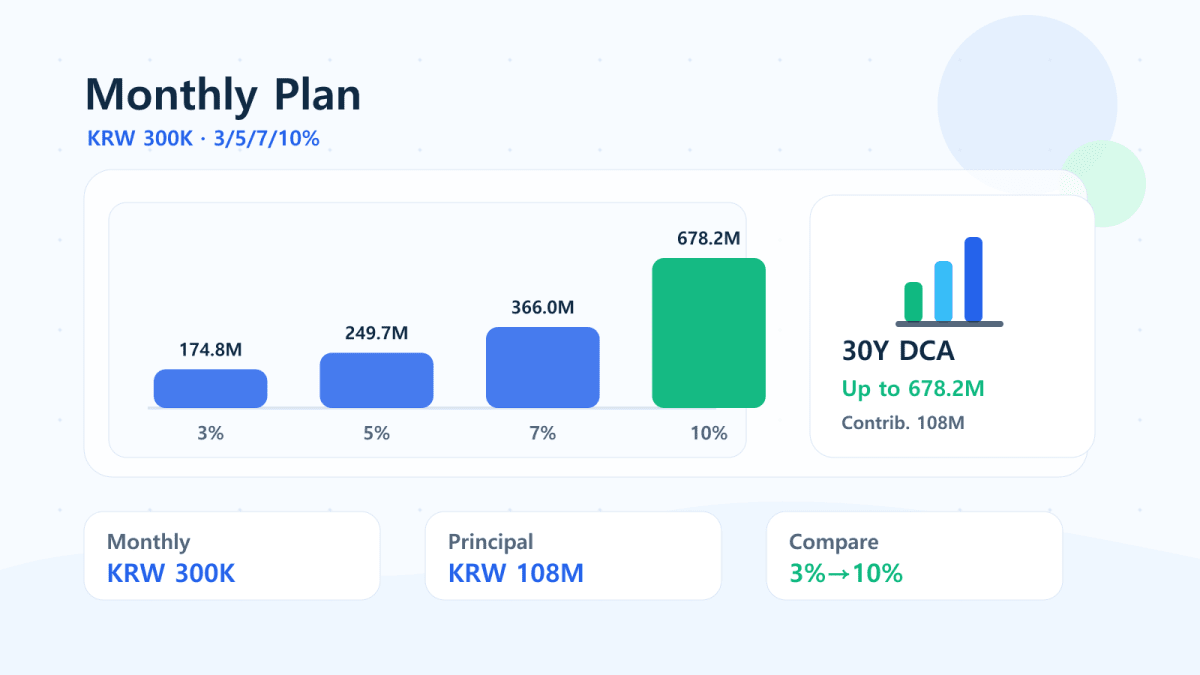
Table B. KRW 300,000 Monthly Contributions
| Horizon | Total Contributions | 3%/yr | 5%/yr | 7%/yr | 10%/yr |
|---|---|---|---|---|---|
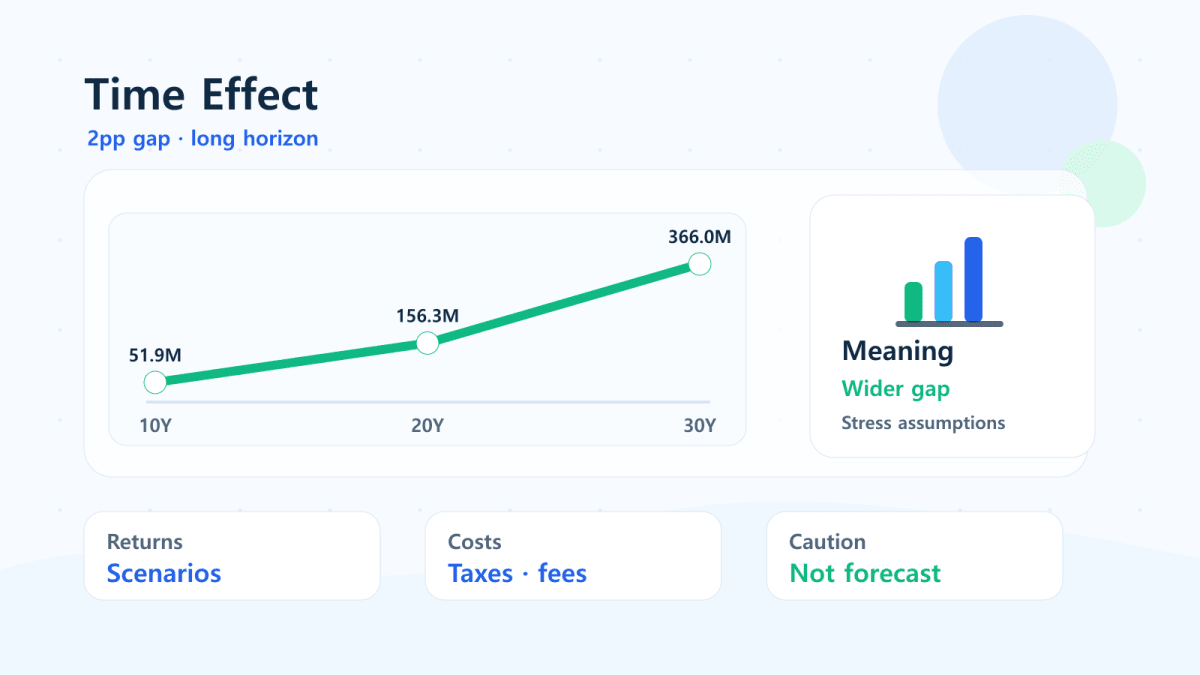
| 10 years | KRW 36.00M | KRW 41.92M | KRW 46.58M | KRW 51.93M | KRW 61.45M |
| 20 years | KRW 72.00M | KRW 98.49M | KRW 123.31M | KRW 156.28M | KRW 227.81M |
| 30 years | KRW 108.00M | KRW 174.82M | KRW 249.68M | KRW 365.99M | KRW 678.15M |
Monthly investing often feels slow at first because most of the early balance comes from contributions. Over long periods, however, more of the existing balance is exposed to the return assumption. That is why the 30-year rows are much wider than the 10-year rows.
Why Even 2 Percentage Points Matter
The difference between 5% and 7% is not just “2% more each year.” Each year’s gain changes the base for the next year. In the monthly table, the 30-year difference between 5% and 7% is about KRW 116.31 million, even though the contribution plan is identical.
That is why long-term planning should use multiple assumptions. A single optimistic return can make a savings plan look easier than it really is. A single pessimistic return can make the same plan look impossible.
Time and Return Work Together
Short horizons are dominated by contributions. Long horizons are more sensitive to return assumptions. This is why a five-year house down payment plan, a 20-year retirement bridge, and a 30-year portfolio plan should not be modeled with the same level of return confidence.
For shorter goals, cash flow and risk control may matter more. For longer goals, taxes, fees, allocation drift, and whether you can stay invested become more important.
Calculator Used in This Article
You can change the assumptions in the Compound Interest Calculator. If you want to compare annualized performance between a starting and ending value, use the CAGR Calculator.
Related reading: Annual vs. Monthly Compounding and What Happens If You Invest $500 a Month for 10 Years?.
Interpretation Notes
- The table is a simplified compounding simulation.
- Taxes, fund fees, trading costs, inflation, and exchange rates are not included.
- A 7% or 10% row is not a guarantee or recommendation.
- Real markets do not move in a clean straight line; two portfolios with the same average return can feel very different along the way.
- This article is educational and does not recommend any financial product.
Citation Note
If you cite this table, cite it as a Finmap compound-interest simulation with taxes and fees set to 0%. Linking back to the article helps readers verify the assumptions and adjust them in the calculator.
FAQ
Are 3%, 5%, 7%, and 10% expected returns?
No. They are comparison assumptions. Actual results depend on the asset, fees, taxes, market path, and holding period.
Why use KRW instead of dollars?
Finmap serves many Korean-language readers, so the example uses Korean won. The same compounding math applies to other currencies if the inputs are consistent.
Does the table include taxes or fund fees?
No. Taxes, fees, inflation, and currency effects are set to zero so the return and time relationship is easy to see.
When should I use a CAGR calculator instead?
Use a CAGR calculator when you know a starting value, ending value, and period, and want to compare annualized growth across different investments or time spans.
Can I cite this table in another article?
Yes, as a reference table, but include the source link and note that the figures are simulations rather than guaranteed returns.