ECONOMICS · REAL RATES
“Rates are up” sounds like one story—until you realize it can mean two opposite things: stronger growth or tighter financial conditions. That’s why the same headline can lift banks on Monday and crush growth stocks on Tuesday.
This post gives you a practical reading frame by splitting yields into what they’re really made of: real rates and inflation expectations (breakevens). Once you can tell which one is moving, the market narrative gets simpler—and your actions get calmer.
- Decode yields into “real” vs “inflation” instead of guessing the story
- Interpret stocks & bonds using a scenario table (growth shock vs inflation shock)
- Build rules for portfolio behavior when real rates jump or breakevens slide
Scope: educational framework only. No ETF/stock recommendations. Use this to create your own rules.

One-page summary: yields have two engines, and markets price the mix
If you remember only one idea, make it this:
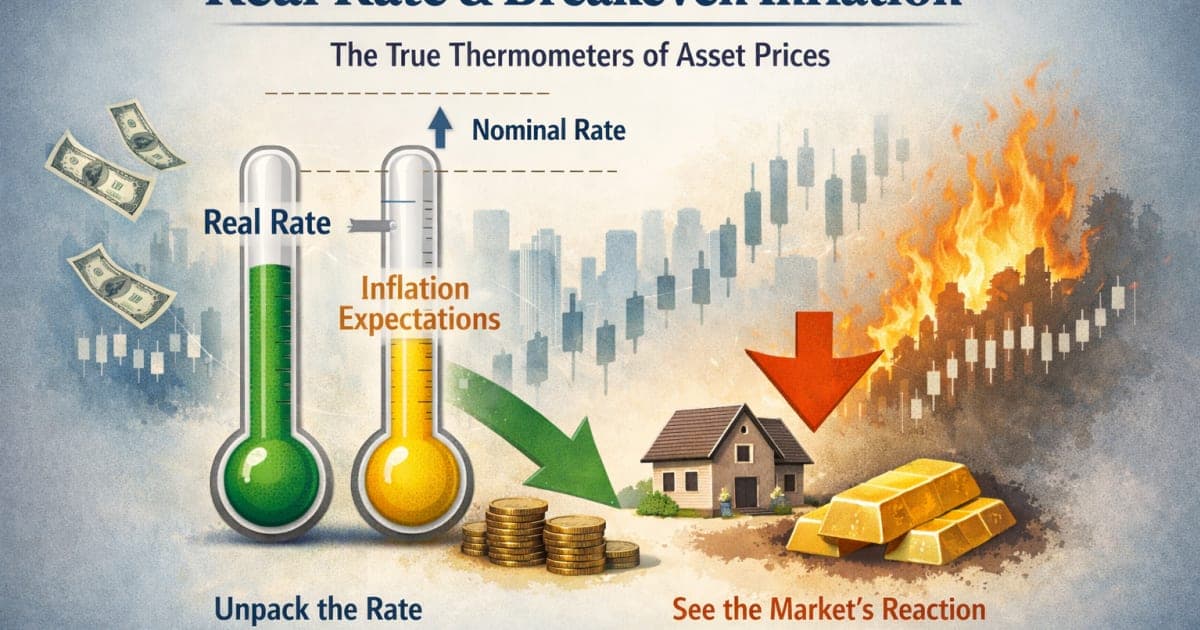
- Nominal Treasury yield moves because of two components:
- Real rate (inflation-adjusted return investors demand)
- Expected inflation (often proxied by breakeven inflation)
A simple approximation many investors use:
Breakeven inflation ≈ Nominal yield − TIPS real yield
So if the 10Y nominal yield rises, it doesn’t automatically mean “inflation is back.” It could be:
- real rates rising (tighter financial conditions), or
- inflation expectations rising (inflation story), or
- both.
That split matters because stocks, USD, and foreign flows react differently depending on which engine is moving.
Start with clean definitions: real rate vs breakeven (and what each is not)
Real rate (Real yield)
Think of the real rate as the market’s “inflation-adjusted required return” for lending money to the U.S. government.
- When real rates rise, financial conditions often feel tighter:
- discount rates increase,
- long-duration assets (growth equities, long bonds) tend to feel pressure,
- USD often strengthens (not always, but often).
Real rates are not a perfect truth serum. They include:
- policy expectations,
- growth expectations,
- risk premia,
- liquidity conditions.
But they’re still one of the cleanest “temperature checks” for risk assets because they directly touch discounting.
Breakeven inflation (Inflation expectations proxy)
Breakevens are a market-implied estimate of average inflation over a horizon (e.g., 5Y, 10Y).
- When breakevens rise, the market is pricing higher inflation expectations (or inflation risk premium).
- When breakevens fall, the market may be pricing:
- lower expected inflation, or
- lower inflation risk premium, or
- growth scare / demand destruction.
Breakevens are not a CPI forecast. They can be distorted by:
- liquidity differences between nominals and TIPS,
- risk premia,
- flight-to-safety behavior.
Why this is an “asset-pricing thermometer,” not just a bond topic
Two reasons real rates and breakevens matter far beyond bond traders:
Equity valuation is a discounting problem
The longer the duration of cash flows (growth stocks), the more sensitive valuations are to real rates.Macro regime changes show up in the split
- Inflation shock tends to raise breakevens (sometimes nominal yields too).
- Tightening / growth resilience tends to raise real rates.
- Recession scare can drop breakevens and real rates—sometimes in different timing.
The point isn’t predicting; it’s identifying which story is being priced.
The market’s “two-question test” you can run in 30 seconds
When yields move, ask two questions:
Did real rates move more than breakevens?
- If yes: “discount-rate story” dominates.
Did breakevens move more than real rates?
- If yes: “inflation narrative” dominates.
This is how you stop treating “rates up” as one monolithic thing.
Don’t react to the yield number. React to the composition of the yield move.
Table 1 — Four macro scenarios: what tends to happen when the split changes
| Scenario | Real rates | Breakevens | Macro interpretation | Common market behavior (not guaranteed) | What to watch next |
|---|---|---|---|---|---|
| A) “Growth resilience / tighter conditions” | ↑ | ↔ or slight ↑ | Real growth + policy tightness | Long-duration equities pressured; USD often firmer; curve can bear-flatten | Financial conditions, credit spreads |
| B) “Inflation shock / supply pressure” | ↔ or slight ↑ | ↑↑ | Inflation risk rising | Commodities/energy can lead; equity dispersion rises | Wages, energy, inflation prints |
| C) “Demand scare / recession risk” | ↓ | ↓ | Growth cooling, inflation expectations soften | Defensive/rates-sensitive assets may stabilize | Claims, PMIs, earnings revisions |
| D) “Disinflation without collapse” | ↓ | ↓ or ↔ | Inflation cools, growth holds | Risk assets can rally if real rates fall gently | Soft landing signals, policy path |
Read this table as tendencies, not promises.
The value is that it gives you a map when headlines try to drag you into reactive mode.
The practical equity link: real rates are the discount-rate dial
Equities are discounted future cash flows.
When real rates rise fast, the “math” shifts even if earnings don’t.
- High duration equities (growth-style cash flows far in the future) often react most.
- Cash-flow-now sectors (some value/defensives) can hold up relatively better.
This is why you can see:
- inflation expectations falling (breakevens down),
- but growth stocks still falling, if real rates are rising (discount rate up).
That combination often confuses investors who only watch CPI narratives.
Table 2 — “Good news becomes bad news” in one chart: why rallies fail in tight regimes
| Headline | Intuitive take | What the market sometimes hears | Split check |
|---|---|---|---|
| “Strong jobs” | Economy good → stocks up | Fed stays tight → real rates ↑ → valuations compress | Did real rates jump? |
| “Inflation cooling” | Rates fall → stocks up | Growth scare → breakevens ↓ + earnings risk | Did breakevens collapse? |
| “Oil down” | Inflation down → bullish | Demand destruction signal | Breakevens ↓ with risk-off? |
The key isn’t cynicism.
It’s recognizing that markets price second-order effects.
A simple dashboard: 5 numbers that reduce macro stress
You don’t need 25 charts. Use a small set:
- 10Y nominal yield (direction & speed)
- 10Y real yield (TIPS) (discount-rate proxy)
- 10Y breakeven (inflation expectations proxy)
- Credit spreads (risk appetite / stress)
- USD strength (DXY or USD/KRW overlay depending on your context)
If you prefer “Korea context,” swap in USD/KRW as your FX stress gauge.
Korea overlay: how real rates leak into USD/KRW and foreign flows
Even if you invest globally, Korea has a unique “translation layer”:
- Higher U.S. real rates can tighten global liquidity conditions.
- That can coincide with:
- stronger USD,
- higher USD/KRW,
- foreign flow sensitivity in KOSPI (especially when risk-off dominates).
This doesn’t mean USD/KRW always rises when real rates rise—markets are messy. But in stress regimes, the alignment happens often enough that it’s useful as a risk lens.
Mid-link (concept reinforcement):
- If you want the “policy vs market” separation that often drives the real-rate narrative, this is a good companion:
Real rates vs breakevens: a rules-based reading method (not forecasting)
Here’s a practical 3-step method you can reuse weekly.
Step 1) Classify the week’s dominant driver
- Driver = real rates if real yields moved more than breakevens
- Driver = inflation expectations if breakevens moved more than real yields
- Driver = mixed if both moved strongly
Step 2) Identify the “risk asset pressure channel”
- If real rates are the driver:
- watch duration-sensitive equities, long bonds, and broad risk sentiment
- If breakevens are the driver:
- watch commodities/energy, inflation-sensitive sectors, and pricing power narratives
- If mixed:
- expect dispersion and headline whiplash
Step 3) Apply a behavior rule, not a prediction
Example rules (illustrative only):
- “If real rates spike quickly, I reduce new risk adds and wait for stabilization.”
- “If breakevens rise but real rates are stable, I expect rotation and avoid overreacting.”
- “If both fall sharply, I treat it as risk-off until credit spreads stabilize.”
The goal: pre-decide behavior so headlines can’t negotiate with your emotions.
Common misconceptions: where investors get trapped
“Nominal yields up = inflation up”
Not necessarily. Real rates can be the driver.“Breakevens are a CPI forecast”
They include premia and liquidity effects.“Real rates are purely Fed policy”
Real rates embed growth expectations, policy path, and risk pricing.“Disinflation is always bullish”
If disinflation comes from demand collapse, breakevens can fall with risk assets.“This is too advanced for retail”
You don’t need to trade it. You just need to interpret it.
Table 3 — Action framework: what to do with each regime (portfolio behavior)
| Regime label | Split signature | What tends to work | What tends to fail | “One sentence rule” |
|---|---|---|---|---|
| Tightening pressure | Real ↑ faster | Cash-flow-now / quality bias; avoid leverage | Overconcentrated growth-duration bets | “Don’t add risk during a real-rate spike.” |
| Inflation flare | Breakeven ↑ faster | Pricing power narratives; inflation hedges (conceptually) | Ignoring cost pressures | “Separate inflation fear from discount-rate fear.” |
| Growth scare | Real ↓, BE ↓ | Defensive posture; avoid chasing early rebounds | Catching falling knives on narratives | “Wait for credit stress to ease.” |
| Soft landing-ish | Real ↓ gently; BE stable | Broad risk can breathe | Over-trading macro noise | “Let stabilization do the work.” |
Use this as a behavior menu, not a performance promise.
A short case study: two identical nominal yields, opposite equity outcomes
Imagine 10Y nominal yield rises 30 bps.
Case A: real rates +30 bps, breakevens flat
- Interpretation: discount-rate shock
- Likely impact: growth equities feel heavy; USD firming risk
Case B: breakevens +30 bps, real rates flat
- Interpretation: inflation expectations shock
- Likely impact: sector rotation; inflation-linked narratives; less direct valuation compression
Same yield move. Different world.
Practical checklist: interpret today’s rates headline in 90 seconds
- □ Did nominal yields move fast (speed matters)?
- □ Was the move mostly real rates or breakevens?
- □ Did credit spreads widen (stress confirmation)?
- □ Did USD strengthen (liquidity/tightening feel)?
- □ Is this a “growth story” or “inflation story” week?
- □ What is my behavior rule for that regime?
A tiny dashboard + a behavior rule beats 50 charts and a scrolling habit.
If you want the “rates foundation,” read these alongside
Mid-link (foundation):
You’ll understand breakevens faster once “inflation mechanics” are clean in your head.
Tool CTA: turn frameworks into numbers you can stick to
Macro indicators are useful only if they improve your consistency. If real-rate spikes make you freeze (or panic), the best fix is often simpler than macro:
- define your goal timeline,
- set a contribution rule you can sustain,
- and make a rebalancing rule you can follow.
Use any of these tools to “anchor” your plan:
- Goal planning (how much is enough):
/tools/goal-simulator - Compounding scenarios:
/tools/compound-interest - DCA consistency checks:
/tools/dca-calculator
Continue reading: the puzzle pieces that connect best
Below are related posts that make real rates easier to apply across markets.
- Interest rates explained — policy rates, deposits, loans, and bonds
- Policy cuts don’t guarantee lower borrowing costs — policy vs market rates
- TNX explained — why the 10-year yield drives markets
- What is DXY? A beginner-friendly Dollar Index guide
- USD/KRW exchange rate — what it means for Korea’s economy and the KOSPI
FAQ: real rates and breakevens (investor questions)
Q1) Are breakevens the market’s CPI forecast?
Not exactly. Breakevens are a market-implied inflation compensation measure that includes risk premia and liquidity effects. They are useful as a direction/pressure gauge, not a precise forecast.
Q2) Why can stocks fall when inflation expectations are falling?
Because the driver might be real rates. If real rates rise (discount rate up), valuation pressure can outweigh the “inflation relief” narrative—especially for long-duration equities.
Q3) Which matters more for growth stocks: nominal yields or real yields?
Often real yields (real rates) matter more because they map more directly to discounting. Nominal yields can rise for inflation reasons without the same valuation impact if real yields stay stable.
Q4) Can breakevens be wrong because of market structure?
Yes. TIPS vs nominals can have different liquidity conditions, and inflation risk premia can shift. That’s why it’s best to use breakevens as a regime indicator, not a point forecast.
Q5) What’s the simplest rule I can use without overtrading?
Use a “dominant driver” rule: if real rates are the main mover, reduce impulse risk adds and wait for stabilization. If breakevens are the mover, expect rotation and avoid treating it like a pure discount-rate shock.
Q6) How does this connect to USD strength?
Rising real rates can tighten financial conditions and often coincide with USD strength, especially in risk-off regimes. That can matter a lot for countries with FX sensitivity, including Korea.
Q7) Do real rates always move with Fed expectations?
Not always. Real rates embed growth expectations, risk pricing, and term premia. Fed expectations matter, but they aren’t the whole story.
Q8) If both real rates and breakevens rise, what does that mean?
It often signals a “mixed” regime: inflation pressure plus tightening conditions. Markets can become headline-sensitive and dispersion can rise. In those periods, behavior rules (position sizing, rebalancing discipline) matter more than narratives.