Summary (10 sentences)
- “Interest rates” are not one number; they form a structure: policy rate → market yields → product rates.
- The policy rate is a direction signal, while market yields reflect expectations about inflation, growth, and risk.
- Deposit and loan rates are shaped by bank funding costs, competition, credit risk, and regulation—not policy moves alone.
- Bonds follow a core rule: yield ↑ → price ↓, and the sensitivity depends largely on duration.
- Short-term yields react more to near-term policy expectations; long-term yields embed longer-run growth/inflation and term premium.
- Yield curves help you read what markets are pricing for the business cycle (slowdown, recession risk, or re-acceleration).
- “Higher deposit rates = always better” can be misleading if real returns and reinvestment risk are ignored.
- “Rates up = everything down” is also too simple; the driver (inflation vs growth) matters.
- Beginners benefit most by using rate knowledge to protect cashflow first (debt, emergency fund, budgeting).
- More advanced investors layer in real yields, curve shape, spreads, and duration control to manage drawdowns.
If rate headlines feel confusing, it’s usually because the article doesn’t specify which rate it’s talking about.
This post connects policy rates, market yields, deposit/loan rates, and bonds into one coherent map—then shows how to apply it to everyday money decisions and portfolio risk.
1. Why interest rates shake markets so often
Interest rates are the “price of money.”
When the price of money changes, the trade-off between spending today and saving for tomorrow shifts—and that affects consumption, investment, hiring, and ultimately earnings.
For investors, rates also matter because they influence discounting.
Many assets are valued by discounting future cashflows back to today, and rates are a key ingredient of that discount rate.
This is why a single rate headline can ripple through:
- bond prices (directly),
- growth-stock valuations (via discounting),
- currency moves (via rate differentials and capital flows),
- liquidity conditions (via financing and risk appetite).
Before reacting to a headline, a simple rule helps:
Ask which “floor” of the rate-building you’re looking at.
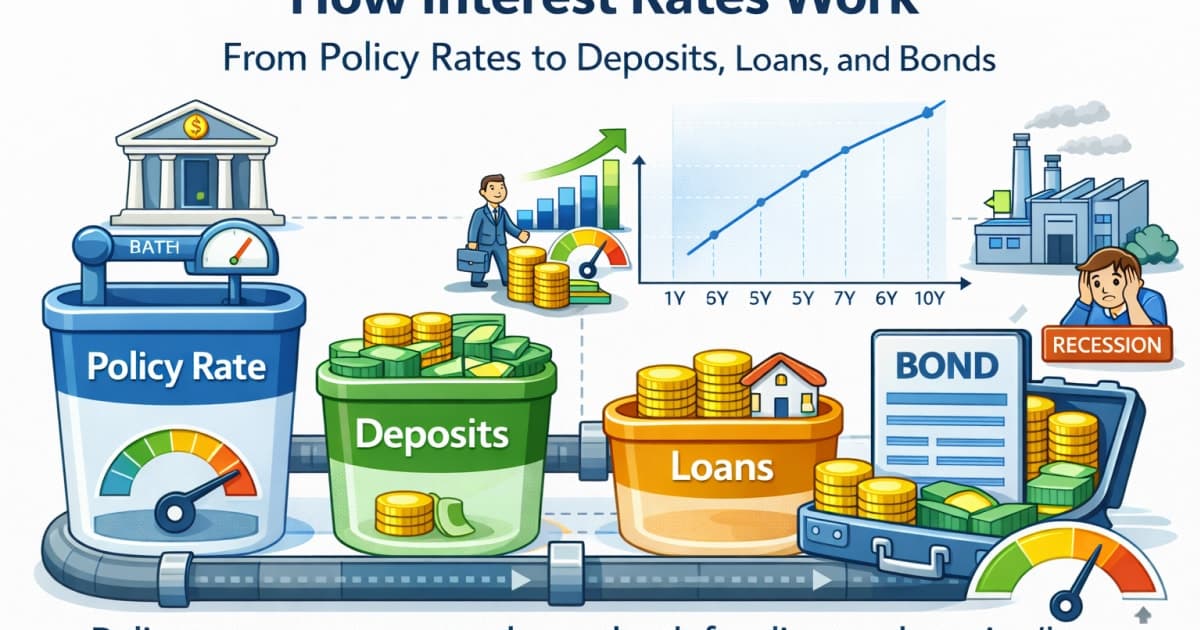
2. A 3-floor map: Policy rate → Market yields → Product rates
Think of rates as a system with three levels:
Floor 1: Policy rate (central bank)
The central bank signals the direction of short-term money.Floor 2: Market yields (bonds / money markets)
Investors price expectations (inflation, growth, recession risk, term premium) into yields.Floor 3: Product rates (deposits / loans)
Banks set rates using funding costs, credit risk, competition, and margins.
These floors are connected, but they don’t move 1:1.
That’s why you may see a rate hike while your deposit rate barely budges—or mortgage rates move faster than policy headlines.
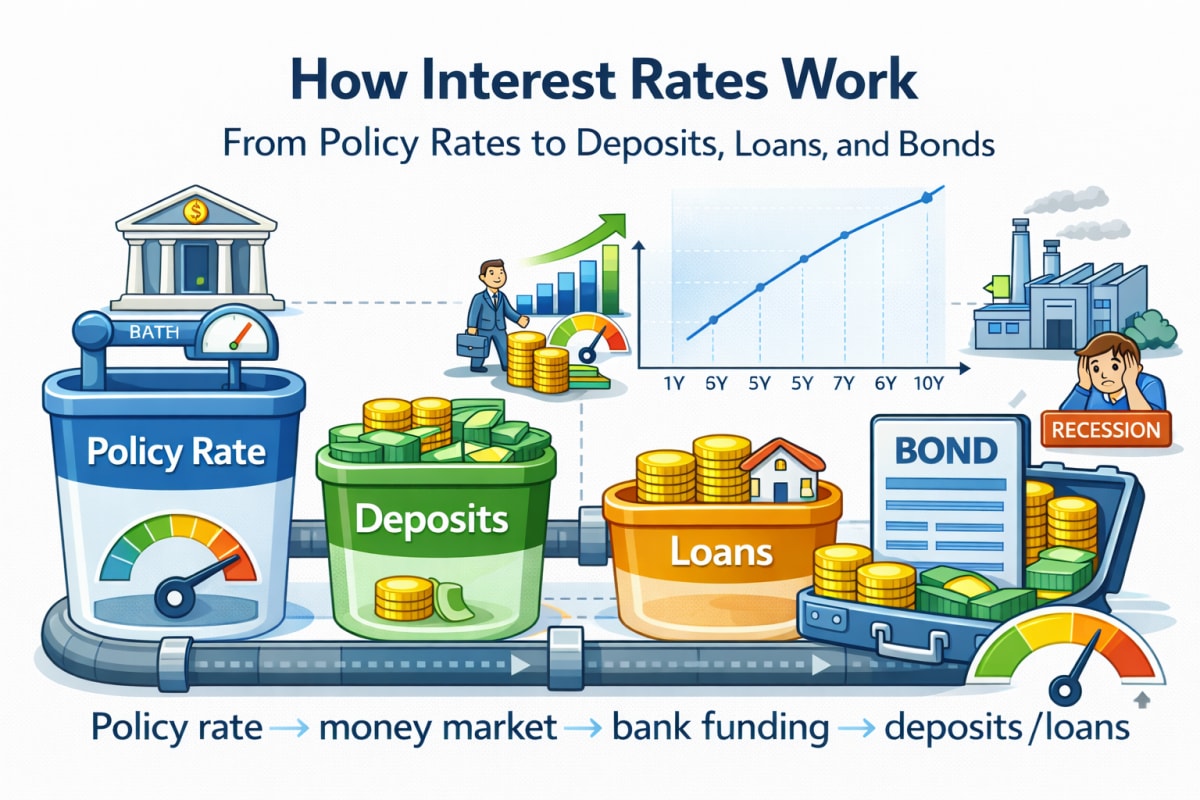
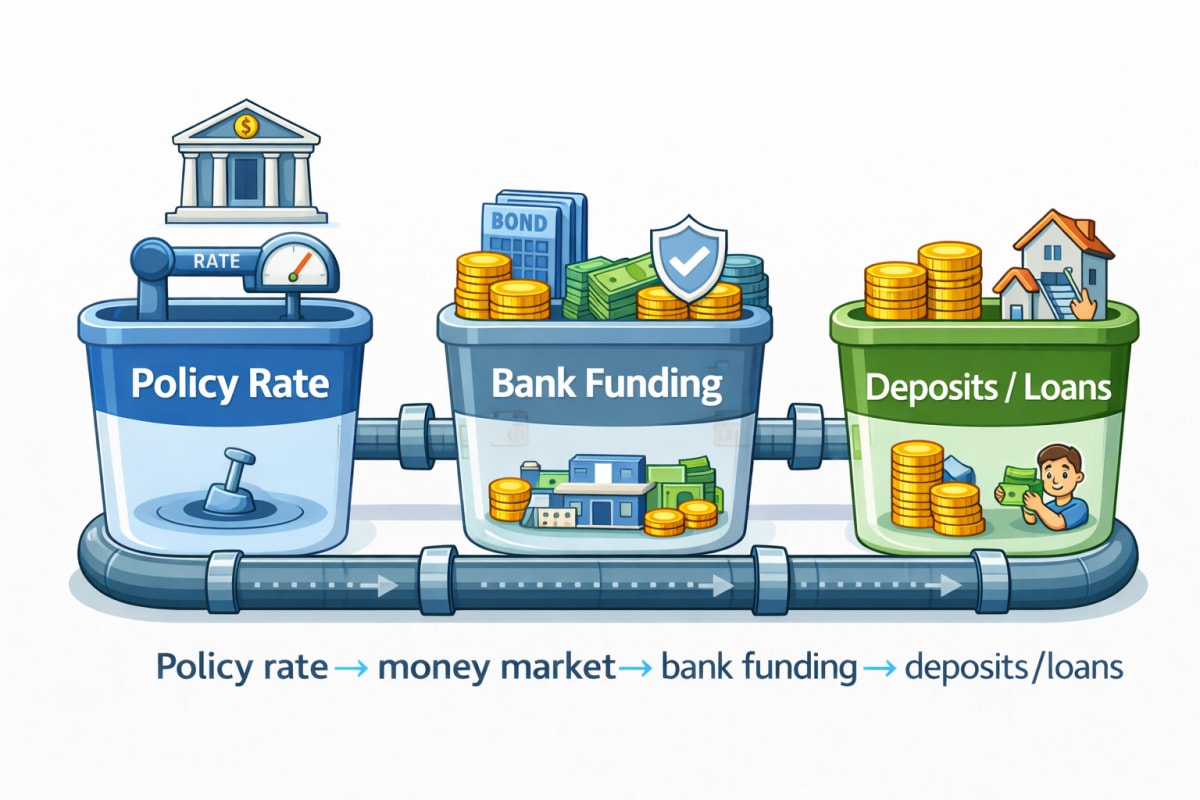
3. the “transmission path” that actually matters
The key is the transmission path
A policy rate move is not the final rate you pay or earn. It transmits through money markets and bond yields, then into bank funding costs, and finally into deposit and loan rates. At each step, expectations, risk premiums, and competition distort the speed and size of the pass-through. If you can identify where the bottleneck is, rate news becomes much easier to interpret—and far more useful in real decisions.
What you’ll take from this
- How to separate policy rate vs market yield vs bank product rates
- The bond yield/price rule—and why duration controls sensitivity
- How to read the yield curve as a cycle expectation tool
- Beginner vs advanced ways to apply rates without “predicting”
4. Policy rates: the signal for short-term money, not the whole economy
Policy rates are the central bank’s main steering wheel for short-term funding conditions.
In practice, central banks target a short-end rate corridor (overnight / very short maturities) and communicate a path via statements and guidance.
What matters for markets is often not the single move, but the path:
- Is the bank saying “higher for longer”?
- Is the next move conditional on inflation data?
- Are they worried about growth, credit, or financial stability?
A common mistake is to treat policy rates as the full story.
In reality, longer-term yields can move differently if markets price a future slowdown, falling inflation, or a reversal in policy down the road.
5. Market yields: why short-term and long-term yields move for different reasons
Market yields are where expectations become prices.
Two key patterns help:
- Short maturities (1–3 years): more sensitive to near-term policy expectations
- Long maturities (5–10+ years): more influenced by long-run growth/inflation, uncertainty, and term premium
This is why you may see:
- policy hikes but long yields falling (markets pricing future weakness), or
- stable policy but long yields rising (markets demanding more inflation/term premium).
Table 1) A practical “rate dictionary” in one view
| Rate type | Typical example | Who drives it most? | What it reflects | What you can infer |
|---|---|---|---|---|
| Policy rate | central bank rate | central bank | short-term policy stance | direction of short funding costs |
| Short-end market yield | 1–2Y gov yield | market + policy expectations | expected policy path | “how many moves are priced?” |
| Long-end market yield | 10Y gov yield | market + term premium | long-run growth/inflation + uncertainty | valuation pressure, liquidity mood |
| Deposit rate | time deposit | banks | funding need + competition + margin | cash parking attractiveness |
| Loan rate | mortgage / consumer loan | banks + credit risk | funding + credit + regulation | household/business stress level |
6. Deposit rates: why they don’t always follow policy moves instantly
Deposit rates look simple from the outside, but banks set them based on:
- how badly they need funding,
- how intense deposit competition is,
- alternative funding access (wholesale markets, bond issuance),
- regulatory liquidity requirements,
- and their target margin.
Even when headline rates rise, a bank with comfortable funding may move slowly.
Conversely, a bank chasing deposits can raise rates aggressively even without a fresh policy move.
Also, “higher deposit rate” does not automatically mean “better outcome.”
Two important caveats:
- Real return: the rate that matters to purchasing power is nominal minus inflation expectations.
- Reinvestment risk: a high deposit rate today may reset lower later; the path matters.
Deposits often function best as a risk-free benchmark and a cashflow stabilizer—especially when your plan depends on staying invested long enough for compounding to work.
7. Loan rates: “reference rate + spread” is the real formula
Most consumer and mortgage loan rates can be conceptualized as:
- a reference funding rate (money-market index / bank funding benchmark), plus
- a spread (credit risk, capital costs, operating costs, margin), minus
- discounts (relationship perks, promotional pricing).
This explains why two borrowers can see very different rates even in the same market.
Credit quality, collateral, term length, and debt-to-income stability all show up in pricing.
For real life, the most important point is:
Rate hikes can hit your cashflow faster than your portfolio can recover.
So before optimizing portfolio returns, it’s rational to stabilize:
- monthly budget,
- emergency buffer,
- and the sensitivity of your liabilities to rate changes.
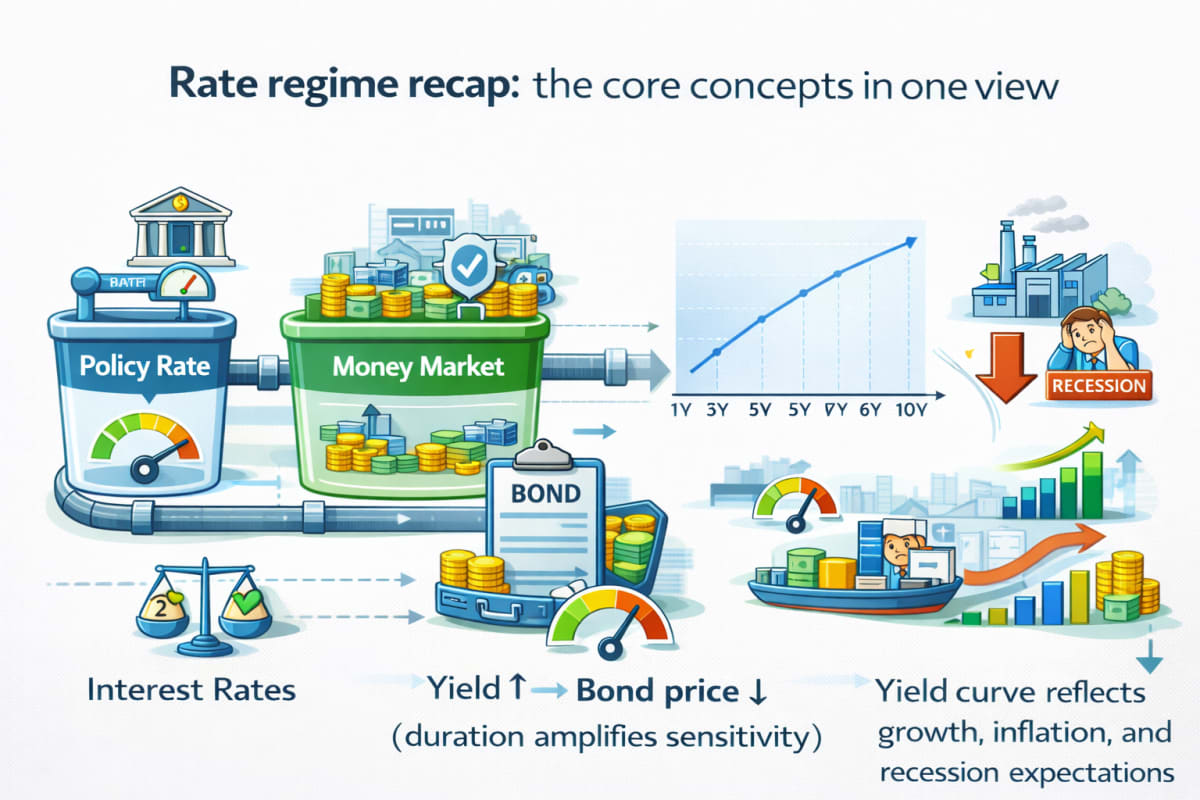
8. Bonds: yield ↑ → price ↓, and duration sets the sensitivity
Bonds confuse many investors because “higher yields” sound good—but the price can fall when yields rise.
Here’s the clean intuition:
- New bonds issued at higher yields become more attractive.
- Existing bonds with lower coupons become less attractive, so their price must fall to compete.
A powerful simplification is duration:
Approx. price change ≈ -Duration × Yield change
So a duration of ~7 implies that a +1% yield move can translate into roughly a -7% price move (a simplified approximation).
Longer duration means higher sensitivity, which is why long-term bond funds can swing more than people expect.
Duration doesn’t “predict,” it simply tells you the risk you’re holding.
9. common rate myths vs rate reality
Common myths
- “Policy rate up → deposit rates instantly soar.”
- “Bonds always lose money when yields rise.”
- “Fixed vs variable loans don’t matter much.”
- “Rate news is about the number only.”
Rate reality
- Deposit rates depend on bank funding demand and competition—not headlines alone.
- Bond outcomes depend on duration, entry yield, and holding period dynamics.
- Loan structure changes long-run total cost and cashflow survivability.
- Markets react to the expected path, real yields, and risk premiums—not one print.
10. Callout — the one-line rule for reading “rate” headlines
11. Visual Overview


12. How rates affect assets: why “real yields” often matter more than nominal
Not all rate moves are equal.
A nominal yield can rise because inflation expectations surge, or because real yields rise (tighter financial conditions), or because term premium increases.
In practical terms:
- Rising real yields often tighten conditions more directly and can pressure long-duration assets.
- Falling inflation expectations can lower nominal yields even if growth is weak.
- Rising term premium can lift long yields without a big change in inflation/growth expectations.
That’s why you sometimes see confusing combinations, like:
- “inflation cooling + yields stable + equities still weak,” or
- “policy unchanged + long yields rising + valuations compressing.”
When you anchor your framework on real yields and the curve, the confusion usually decreases.
13. Two portfolio scenarios: same returns, different rate risk
This section is for intuition, not product recommendations.
Scenario A: Long-duration-heavy exposure
- higher sensitivity to rate changes (long bonds, growth-tilted assets)
- can benefit strongly when yields fall
- can feel painful when yields rise quickly
Scenario B: Short-duration and cashflow-resilient exposure
- lower rate sensitivity (short bonds, cash-like instruments)
- tends to hold up better during hiking cycles
- may under-participate when rates drop sharply and duration rallies
Table 2) “1% yield move” sensitivity (intuition-only)
| Asset / situation | If yields rise by ~1% | If yields fall by ~1% | What to check |
|---|---|---|---|
| Long bonds / long-duration funds | larger price drawdown | larger price rebound | duration, holding horizon |
| Short bonds / cash-like | smaller impact | smaller impact | role as cash substitute |
| Growth-tilted equities/ETFs | valuation compression risk | valuation relief | real yields, discounting |
| Value/defensive mix | mixed (sector-dependent) | mixed | margins, cycle dynamics |
| Variable-rate borrower | interest expense rises | interest expense falls | budget, refinance options |
14. Beginner playbook: use rate knowledge to protect cashflow first
For beginners, the highest ROI is usually not forecasting rates.
It’s using rate awareness to avoid getting forced into bad decisions.
A practical order:
- Build an emergency buffer that prevents forced selling.
- Reduce the sensitivity of liabilities to rate shocks (loan structure and payment plan).
- Only then optimize portfolio aggressiveness.
Why? Because portfolio returns can be volatile, but loan payments are not optional.
Surviving the cycle is often more valuable than “winning” one quarter.
15. Advanced playbook: focus on the “character” of rates, not the level
More advanced investors tend to ask different questions:
- Is this move inflation-driven or growth-driven?
- Is the curve steepening or flattening—and why?
- Are spreads widening (risk premium rising)?
- How much duration am I actually holding across the full portfolio?
This approach doesn’t require perfect prediction.
It turns “rates” into a risk control knob, especially useful when drawdowns matter as much as returns.
16. Connect to FinMap: turn rate assumptions into numbers
Rates change the “baseline return” environment.
Even a small shift in assumed annual return can reshape long-horizon outcomes.
A simple workflow:
- Use the compound interest tool to test how a +1% or -1% return assumption changes outcomes.
- Use the goal simulator to stress-test time horizon vs monthly contribution vs expected return.
- Then revisit your assumptions when rate regimes shift (hikes, cuts, or “higher for longer”).
This is how rates become actionable without becoming a prediction game.
17. Checklist (quick self-audit)
- When reading “rates,” did I identify policy vs market vs product rates?
- Did I check whether the move is short-end or long-end (maturity)?
- Do I understand whether inflation, growth, or risk premium is the driver?
- If I own bonds, do I know the duration sensitivity?
- If deposit rates look attractive, did I consider real returns and reinvestment risk?
- If I have variable-rate debt, do I have enough cashflow margin and buffer?
- Is my portfolio designed to survive a rate hike cycle without forced selling?
18. Conclusion (3 lines)
Interest rates are a structure, not a single number.
If you can map policy rates → market yields → deposit/loan rates—and understand bond duration—you’ll interpret headlines with much more clarity.
The goal is not perfect forecasting; it’s holding the right level of rate sensitivity for your cashflow and plan.
Stress-test your plan under different rate regimes
A 1% change in assumed annual returns can materially shift long-term outcomes. Use FinMap tools to quantify your assumptions first—then use rate news to refine them over time.
Open the Compound Interest Tool19. A good piece of writing to read together
- Inflation & Interest Rates Basics
- FX Basics: What Really Moves USD/KRW?
- How to Read Economic Indicators: GDP · Unemployment · PMI
- U.S. 10Y Yield (TNX): Why It Matters to Markets
- Why ETFs React to TNX: Rates · FX · Liquidity
- Is “7% Compounding” Realistic? CAGR Reality Check
FAQ
Q1. Do I only need to watch the policy rate?
The policy rate is the direction signal, but market pricing often moves first in bond yields.
For better context, check the yield curve (short vs long maturities) alongside policy decisions.
Q2. Do bonds always lose money when yields rise?
Prices can fall in the short run, but outcomes depend on duration, entry yield, and how long you hold.
Duration tells you the sensitivity you’re actually holding.
Q3. If deposit rates are high, should I stop investing?
Deposits can be attractive, but real returns and long-term goals still matter.
Many investors treat deposits as a benchmark and buffer, while keeping a separate long-term investment routine.
Q4. Fixed vs variable loans—what’s better?
It depends on the rate path, but for many people the priority is cashflow stability over prediction.
Choose a structure you can sustain across adverse rate regimes.
Q5. Why is the yield curve important?
The curve reflects the market’s combined expectations for growth, inflation, and recession risk.
Curve inversions can signal that markets are pricing slower growth ahead, which often changes risk appetite.