Summary (10 sentences)
- TNX is the market’s discount-rate headline, and that alone can move stock valuations.
- When TNX rises fast, duration-heavy assets (growth/tech, long bonds) usually react first.
- TNX also shapes the USD cycle, which directly matters for USD/KRW and foreign flows.
- The speed of the move often matters more than the level in the short term.
- A higher yield can be “good growth” or “bad inflation”—context changes the reaction.
- The yield curve adds meaning: the same TNX level can imply different regimes.
- Don’t treat TNX as a single on/off switch; read it through valuation, FX, and liquidity channels.
- In Korea, FX sensitivity and foreign ownership can amplify TNX-driven swings.
- The best edge is process: a checklist beats headline-based trading.
- If you can explain why TNX moved, you can respond calmly instead of chasing price.
One-paragraph overview
TNX—the U.S. 10-year Treasury yield—acts like a global reference rate. It changes how investors discount future cash flows, how currencies reprice risk, and how liquidity conditions feel across markets. The goal isn’t to “predict TNX,” but to identify which channel is active (valuation vs FX vs liquidity) and adjust expectations, risk, and time horizon accordingly.
What you will get from this guide: a quick way to decide whether a TNX move is a valuation shock, a dollar/FX shock, or a liquidity shock. You will also get a simple checklist for connecting TNX to the KOSPI, USD/KRW, growth stocks, bond ETFs, and your own investment plan.
| If TNX is moving because... | First market signal to check | Practical response |
|---|---|---|
| Growth expectations improve | Cyclicals, earnings revisions, credit spreads | Avoid treating all yield increases as bearish |
| Inflation or policy fear rises | DXY, USD/KRW, real yields, growth-stock multiples | Reduce headline chasing and watch financial conditions |
| Liquidity stress appears | VIX, breadth, credit spreads, foreign flows | Prioritize risk sizing and contribution rules |
Related reads: Yield curve recession signals, USD/KRW and the KOSPI, and Why Korea ETFs are sensitive to TNX. To turn macro stress into a rules-based plan, test assumptions with the DCA simulator or CAGR calculator.

If you’re here because “rates” headlines are confusing, this separation removes 80% of the noise:
And if you want the “TNX context layer” that most people miss (curve shape), start here:
Macro anchor
TNX is one number that quietly touches everything: stock multiples, bond prices, USD strength, and cross-border flows. Read it like a map—level, speed, and context—so you don’t confuse noise with regime change.
Key takeaways
- Valuation channel: higher discount rate → lower multiples for long-duration stocks.
- FX channel: higher U.S. yields can support USD → pressure EM FX like KRW.
- Liquidity channel: rising yields often tightens financial conditions.
- Context matters: “growth-driven” vs “inflation-driven” yield moves react differently.
1) TNX in one sentence: the market’s discount-rate headline
A stock price isn’t just “earnings × a number.” That “number” (the multiple) is heavily shaped by the discount rate investors apply to future cash flows. TNX isn’t the only discount rate, but it’s the one the market references most often.
That’s why you’ll frequently see this pattern: when TNX jumps quickly, growth-heavy indices sell off first—sometimes even when the economy looks “fine.” It’s not always fear. Sometimes it’s math.
2) The three channels: valuation, FX, and liquidity
Most confusion comes from mixing channels. TNX can move markets through different routes, and each route points to a different “best response.”
Channel A — Valuation (discount-rate effect)
- Higher yields generally mean higher discount rates.
- Higher discount rates compress valuations for long-duration assets (growth/tech, long-horizon projects).
- The impact is stronger when the move is fast (shock) rather than slow (digestible).
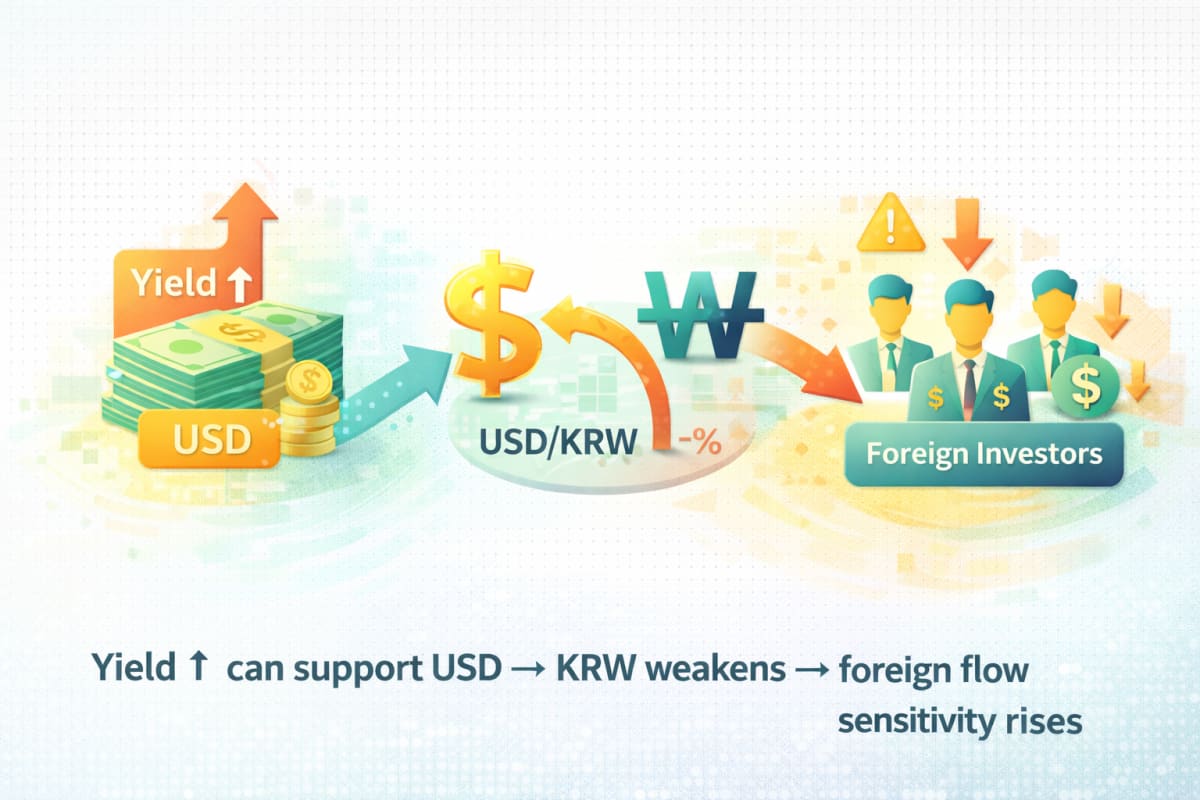
Channel B — FX (USD and capital flows)
- Higher U.S. yields can make USD assets more attractive.
- That can strengthen USD and weaken EM FX—KRW included.
- FX moves often trigger foreign flow adjustments and hedging behavior.
If you want a practical “Korea translation” for this FX channel:
- 🔗 USD/KRW Exchange Rate: What It Means for Korea’s Economy and the KOSPI
- 🔗 Who Wins and Loses When the KRW Weakens? (KOSPI Sector Map)
Channel C — Liquidity (financial conditions)
- Rising yields often tighten financial conditions: borrowing costs rise, risk appetite cools.
- When liquidity thins, correlations rise—and diversification “feels worse” temporarily.
Quick map (table)
| TNX move | Dominant channel | Typical winners | Typical losers | What to watch next |
|---|---|---|---|---|
| TNX ↑ slowly | Valuation (soft) | Value/defensives, cash-like | High-duration growth | earnings revisions, credit spreads |
| TNX ↑ fast | Liquidity + valuation | USD, short-duration, quality | Growth, small caps, EM | DXY, USD/KRW, funding stress |
| TNX ↓ fast | Liquidity easing | Risk assets, growth | USD, cash | curve shape, inflation expectations |
| TNX ↑ with inflation fear | FX + liquidity | USD (often), hedged assets | EM FX, long bonds | breakevens, DXY |
| TNX ↑ with growth optimism | “Good growth” | Cyclicals, breadth | Low-growth bond proxies | PMI, earnings breadth |
3) The part most investors miss: level vs speed
A yield of 4.5% is a level. A move from 4.0% to 4.5% in two weeks is a shock. Markets price change, not just levels.
- Speed matters for positioning. Fast moves force de-risking, leverage reduction, and hedging.
- Level matters for valuation anchors. Over time, levels influence expected returns and “fair” multiples.
If you only track the level, you’ll miss why the same TNX level can coexist with both rallies and sell-offs.
When the move is shock-like, “what triggered it” often matters more than the yield itself. Two common headline regimes:
- Geopolitics / risk-off: USD liquidity + positioning can dominate the response
🔗 Geopolitics → USD Liquidity → FX: the channel checklist - Policy / trade shock: markets reprice growth + margins + FX as a package
🔗 Tariffs as a Package Shock: Growth, Margins, FX, and Inflation
4) Yield curve context: same TNX, different story
TNX alone can mislead. The yield curve adds context by showing whether the 10-year yield is moving because:
- growth expectations improved,
- inflation expectations re-accelerated,
- or policy is expected to stay tight longer.
A steepening curve can mean something very different than an inversion deepening. Markets often react to “what TNX implies about the next 6–18 months,” not just the yield itself.
Common mistake
- “TNX up = stocks down” as a fixed rule
- Ignoring why yields moved
- Reacting without checking FX and liquidity
Better process
- Identify the driver: inflation vs growth vs policy
- Check speed: gradual or shock?
- Confirm with FX (USD/KRW) + risk gauges (VIX/credit)
If you want a cleaner “curve-first” reading that avoids overreacting:
5) Why Korea often feels TNX more than the U.S. itself
Korea sits at the intersection of USD cycles, global liquidity, and a tech-heavy equity structure. That combination can amplify TNX moves.
Three amplifiers
- FX sensitivity (USD/KRW): USD strength and KRW weakness can reshape foreign flow behavior.
- Ownership structure: higher foreign participation can accelerate rebalancing.
- Index composition: growth/export sensitivity increases discount-rate and FX exposure.
This is the same “U.S. → Korea” transmission logic, summarized as a checklist here:
That’s why “TNX up” can feel like “KOSPI liquidity down,” even if domestic fundamentals didn’t change overnight.
6) read TNX like a map


7) Practical investor playbook (beginner vs advanced)
Beginner version — avoid 3 classic overreactions
Overreaction #1: selling everything because “rates are up.”
Rates up can still mean “good growth,” and markets can rotate rather than collapse.
Overreaction #2: treating one headline as a regime change.
A one-week spike isn’t the same as a multi-quarter trend. Speed and follow-through matter.
Overreaction #3: ignoring FX if you invest in Korea or EM.
For KR assets, FX can be the difference between a mild pullback and a sharp sell-off.
Beginner checklist (use it every time TNX moves)
- Did TNX rise because inflation fears or growth optimism?
- Did the move happen gradually or suddenly?
- What did USD do at the same time (DXY, USD/KRW)?
- Did credit spreads widen or stay calm?
- Did leadership rotate (growth → value) or did everything sell?
- Are earnings revisions improving or deteriorating?
- Is your horizon long enough to ignore a short macro shock?
Advanced version — connect TNX to regime and positioning
Advanced investors focus less on “direction” and more on regime. The same TNX move can represent:
- duration unwinds,
- FX-driven de-risking,
- or pure liquidity tightening.
Advanced signals to watch
- real yield vs inflation expectations split (driver matters),
- curve shape changes (steepening vs inversion dynamics),
- cross-asset confirmation (DXY, VIX, credit spreads),
- correlation spikes (a liquidity stress clue).
If you want the “USD layer” that often co-moves with TNX in stress regimes:
8) Mini scenarios: the same TNX level, two different outcomes
| Scenario | TNX move | Driver | Typical market behavior | What you do |
|---|---|---|---|---|
| A. “Good growth” | TNX ↑ | growth optimism | cyclicals lead, breadth improves | rebalance, avoid panic |
| B. “Bad inflation / tight policy” | TNX ↑ | inflation fear / hawkish path | USD up, EM FX weak, risk-off | reduce leverage, respect FX risk |
| C. “Liquidity relief” | TNX ↓ | easing expectations | growth rebounds, credit improves | add risk gradually, watch curve |
| D. “Recession signal” | TNX ↓ | growth fear | defensives lead, earnings cut | prioritize quality and cashflow |
The point isn’t perfect forecasting. It’s avoiding the wrong playbook for the wrong regime.
9) When TNX is most disruptive: policy surprises + thin liquidity
TNX becomes truly disruptive when policy expectations shift quickly and liquidity is thin. That’s when:
- moves accelerate,
- spreads widen,
- and diversification fails.
At those moments, macro “knowledge” matters less than risk management basics: position sizing, time horizon, and the ability to hold through volatility.
One shock channel that often re-ignites inflation + rates + USD together is oil:

10) FinMap tools to turn TNX headlines into numbers
Turn a macro headline into a return range
TNX headlines feel abstract until you see how assumptions change outcomes. Stress-test your plan with realistic return bands rather than a single “expected return.”
Open CAGR calculatorPlan with ranges (4–8%), not one forecast
TNX regimes can change return paths. Use a range-based goal plan to see how much monthly investing you need under multiple scenarios.
Open goal simulator11) A good piece of writing to read together
- Understanding Interest Rates: Policy Rates, Market Rates, and How They Influence Deposits, Loans, and Bonds
- Inflation and Interest Rates Explained: Why Rate Changes Shake Markets
- Currency Basics: What Really Moves the USD/KRW Exchange Rate
- How DXY Moves the Market: Impact on U.S. Stocks, USD/KRW, and KOSPI
- How U.S. 10Y Yield (TNX) Affects ETFs: Growth, Value, EM, and Korea
- How the U.S. 10-Year Treasury Yield (TNX) Affects the U.S. Economy, Korea, and Global Stock Markets
Extra: “indexing push” links (highly connected targets)
- Policy vs Market Rates
- Yield Curve Reading: 2s10s vs 3m10y
- USD/KRW → KOSPI chain
- KRW weakness winners/losers (sector map)
- S&P 500 → Korea chain
- What is DXY?
- Geopolitics → USD liquidity → FX
- Tariffs as a package shock
- Oil shocks → USD/KRW transmission
12) Conclusion (3 lines)
TNX is not a prediction game—it’s an interpretation game.
Identify the channel (valuation, FX, liquidity), then choose the right playbook.
A calm checklist beats a reactive trade almost every time.
FAQ
What is TNX in simple terms?
TNX is the yield on the U.S. 10-year Treasury. Investors use it as a benchmark for the “price of money over time,” which influences stock valuation, bond prices, and currency flows.
Does TNX always move opposite to stocks?
No. TNX rising due to stronger growth can support cyclical stocks. TNX rising due to inflation fear or tight policy expectations can pressure risk assets. Context matters more than direction.
Why do growth stocks react more to TNX?
Growth stocks have more value in future cash flows. When discount rates rise, those future cash flows are worth less today, so valuations compress.
Why does TNX matter for Korea and KOSPI?
Korea is sensitive to USD cycles and foreign flows. TNX can strengthen USD and weaken KRW, tightening conditions and amplifying market moves in a tech-heavy index.
What should I check when TNX moves?
Start with: (1) driver (inflation vs growth vs policy), (2) speed, (3) USD/KRW, (4) credit spreads and volatility, (5) market breadth and sector leadership.