ECONOMICS · YIELD CURVE
“The yield curve inverted, so a recession is coming” is a headline everyone recognizes. The problem: different curves can invert at different times—and sometimes one “heals” while the other stays inverted.
If you’ve ever wondered, “2s10s is back above zero but 3m10y is still inverted—so are we safe or not?” you’re asking the right question.
This post is not a timing call. It’s an interpretation framework and a rules-based action plan so curve news stops feeling like a riddle.
- What each spread is actually measuring (they answer different questions)
- When divergence is normal—and when it’s a warning
- A simple checklist that translates curve headlines into portfolio behavior
Scope: no stock/ETF picks. This is about reading signals and building durable rules.
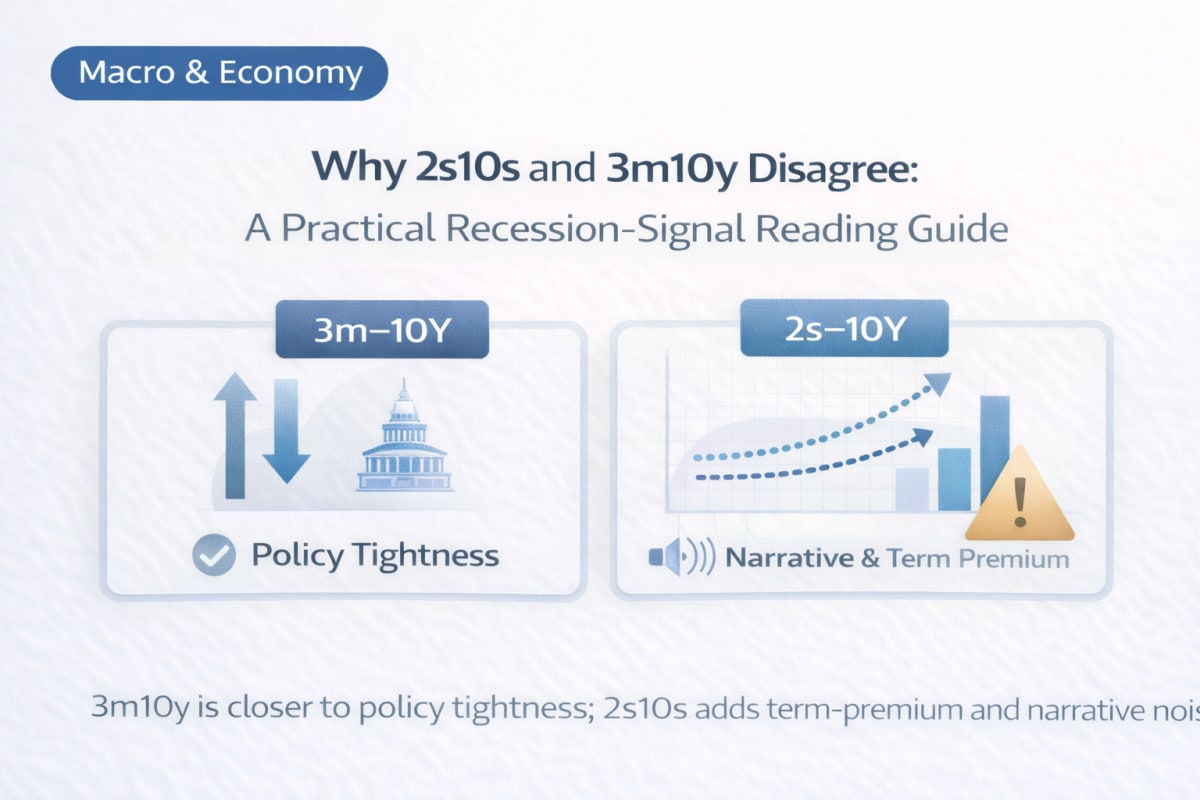
- Takeaway 1: 3m10y is closer to the “policy path vs long yield” question—often a tighter recession proxy in classic textbooks.
- Takeaway 2: 2s10s mixes growth expectations with term premium and risk appetite; it’s useful, but easier to “move” for reasons unrelated to recession.
- Takeaway 3: When the two disagree, don’t argue “recession or not.” Ask: is the stress in policy tightness, or in credit/risk pricing?
- Takeaway 4: The curve is not a date picker. It’s a map of financial conditions that affect loans, hiring, and earnings with lags.
- Takeaway 5: Depth, duration, and what else is widening (credit spreads, funding stress) matter more than a single screenshot.
- Takeaway 6: For non-U.S. investors, overlay FX and global rates—local borrowing costs often follow the global “price of money.”
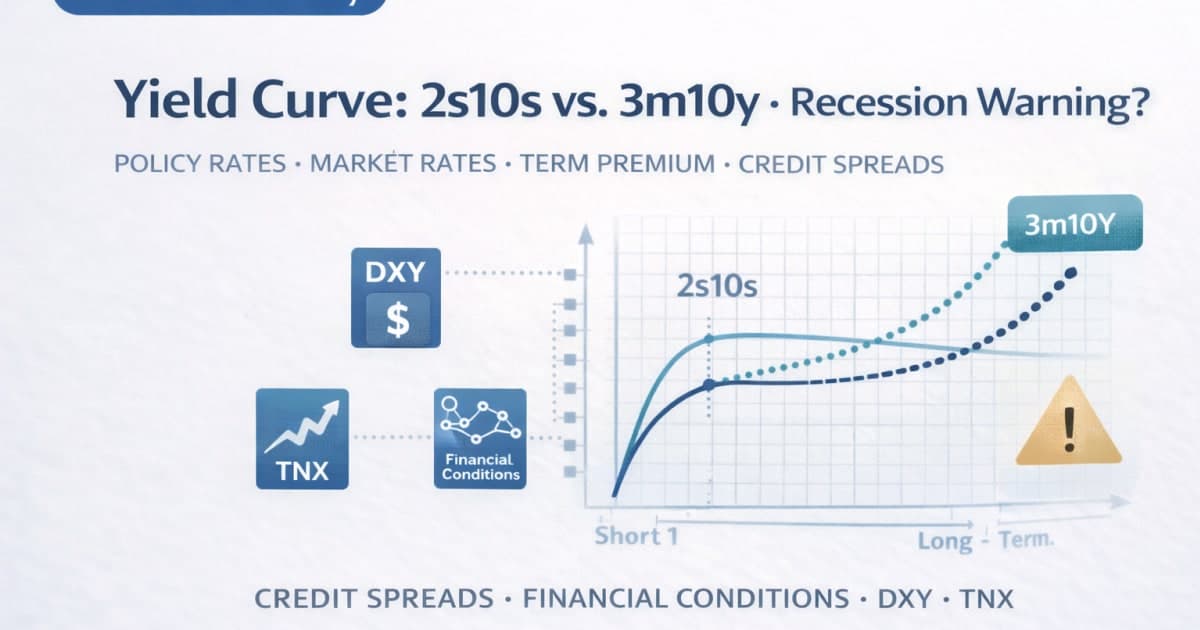
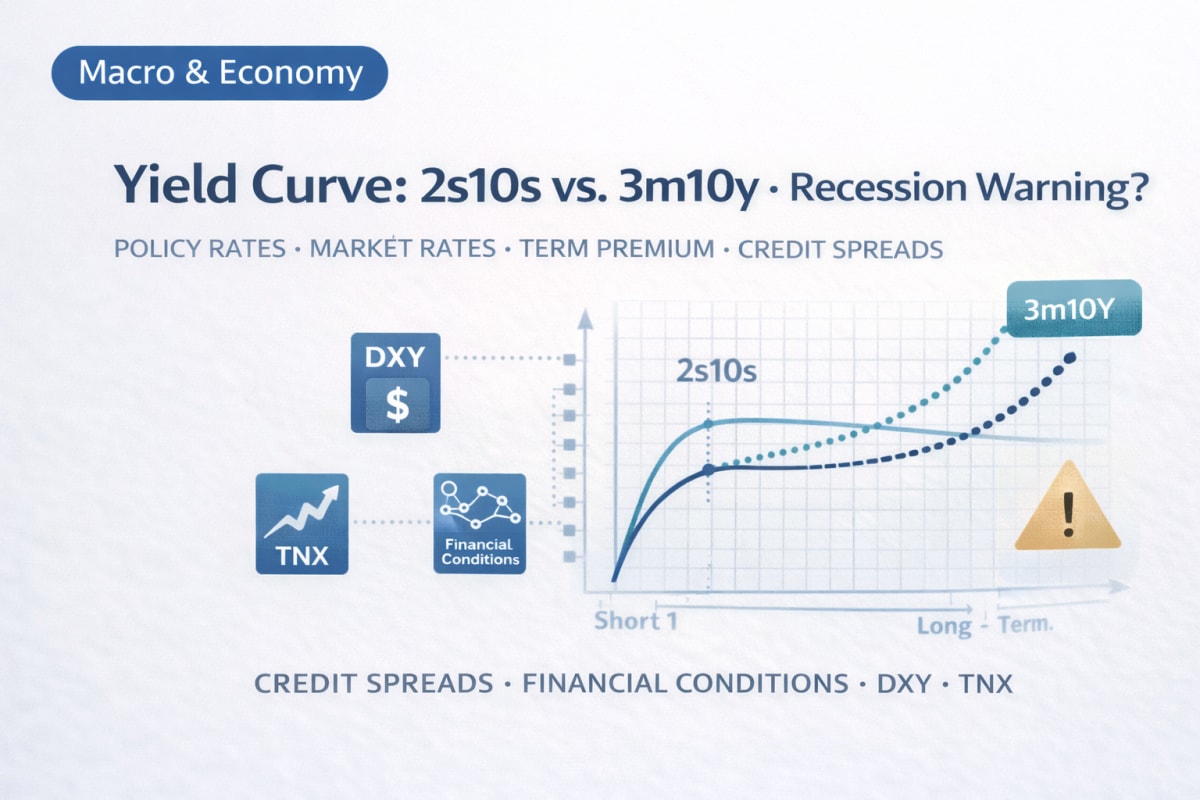
Two curves, two questions: why they can disagree without “one being wrong”
Both spreads are called “the yield curve,” but they emphasize different parts of the rate structure.
- 2s10s: 10-year yield minus 2-year yield
- Heavily influenced by near-term rate expectations (2-year) and long-term growth/inflation narrative (10-year), plus term premium.
- 3m10y: 10-year yield minus 3-month bill yield
- 3-month is more mechanically tied to current policy settings and the very front end of money markets.
In plain language:
- 3m10y asks: “Are today’s short rates so tight that they’re above what the long run can sustain?”
- 2s10s asks: “What’s the market’s medium-term story, and how is risk priced across the curve?”
That’s why they diverge. They’re not duplicates; they’re different lenses.
The three drivers that keep you from overreacting to curve headlines
If you only remember three buckets, remember these:
- Policy path (expected short rates)
- Growth/inflation narrative (long-rate fundamentals)
- Term premium + risk pricing (uncertainty, supply/demand, regime risk)
Curve moves are usually one of these buckets dominating.
A practical rule:
- If the move is mostly policy-path driven, it tends to show up in 3m10y more clearly.
- If the move is mostly term premium/risk pricing driven, it can show up more in 2s10s without implying “recession tomorrow.”
Four common divergence scenarios and what they usually mean
Think of this as a “pattern library,” not a prophecy.
Scenario A: 3m10y deeply inverted, 2s10s re-steepening
- Interpretation: policy is still tight relative to the long run, but longer-term narrative or term premium is shifting.
- Investor risk: you assume “all clear” because 2s10s looks better, while tight front-end conditions still pressure credit.
Scenario B: both inverted, and staying inverted
- Interpretation: policy tightness + weaker forward narrative can coexist.
- Investor risk: panic-sell everything instead of building a rules-based risk plan for a slow grind.
Scenario C: both normalize quickly
- Interpretation: rates structure is “less abnormal,” but lags matter.
- Investor risk: you treat normalization as “recession cancelled,” ignoring the delayed impact on hiring, loans, and earnings.
Scenario D: 2s10s re-inverts while 3m10y improves
- Interpretation: the market is less worried about immediate policy tightness, but more worried about longer-run uncertainty or supply/term premium dynamics.
- Investor risk: you interpret it as purely recession, when it may be “risk pricing” or long-end supply/regime stress.

The biggest mistake: treating an inversion like a calendar date
Yield curves are famous because they often precede recessions—but “precede” doesn’t mean “schedule.”
The curve is best used as a conditions map:
- Tight policy and inverted front-end conditions can translate into:
- tougher bank lending
- higher debt servicing costs
- weaker hiring
- slower consumption
- weaker earnings
These effects arrive with lags and vary across economies.
A better use-case:
- Use inversions to stress-test your plan, not to predict a month.
A simple translation table: from curve change to “what I do next”
You want something you can execute without becoming a macro analyst.
| Signal | What it often implies | Your personal finance move | Your investing rule (example) |
|---|---|---|---|
| 3m10y stays inverted for months | tight policy pressure remains | increase cash buffer; reduce payment stress | keep DCA, reduce leverage, rebalance by rule |
| 2s10s steepens because long yields rise fast | long-end discount rate pressure | avoid new fixed-rate commitments at peak stress | review duration-sensitive exposure; don’t chase rallies |
| Both normalize but credit spreads widen | stress moving into credit | check refinancing timeline; avoid variable-rate shocks | prioritize quality/defensives; keep rules simple |
| Curve normalizes and credit spreads stabilize | conditions easing | rebuild emergency fund targets | gradually restore risk via schedule, not headlines |
This is the core shift:
curve headlines → your cashflow risk → your portfolio rules.
The credit overlay: when the curve matters more (and when it matters less)
If you want one “upgrade” beyond the curve, add credit conditions.
Two quick signals:
- credit spreads widening (risk rising)
- lending standards tightening (banks pulling back)
A curve inversion without credit stress can still matter—but credit stress is often the channel where “macro becomes personal.”
If you want a clean mental model of rates as “decisions vs prices,” this post connects directly:
Non-U.S. overlay: why your borrowing costs may not follow your central bank
For global investors, the “price of money” is partly imported.
Even if your local policy rate is stable, global long yields and FX can tighten conditions.
Korea is a clear example:
- U.S. long yields (often proxied by 10-year Treasury yield) can influence global funding conditions.
- FX moves (USD/KRW) can tighten local financial conditions even without domestic hikes.
You don’t need to become an FX trader. You just need a rule:
If your local currency is weakening sharply while global yields rise, treat it as tighter conditions until proven otherwise.
If you want a Korea-focused bridge:
Your rules-based action plan (copy/paste and customize)
Here’s a minimal rule set most retail investors can actually follow.
- I will not change my risk level based on a single curve screenshot.
- If 3m10y is inverted for 3+ months, I increase my emergency fund target and reduce leverage.
- I rebalance on schedule (quarterly/semiannual) or by bands—not based on headlines.
- If credit spreads widen materially, I tighten my “new risk” rules (smaller position sizes, slower adds).
- I keep DCA consistent unless my cashflow risk changes (job risk, big expenses, refinancing).
- I write one sentence for what would make me increase risk and what would make me reduce risk.
The goal is not to be right.
The goal is to stay in the game.
Suggested tools to convert “macro worry” into “my numbers”
Turn uncertainty into a plan
When macro signals get loud, confirm your monthly contribution is realistic and sustainable—consistency beats prediction.
Goal Simulator →Make DCA rules you can actually keep
Instead of timing recessions, set contribution rules that survive drawdowns and rate cycles.
DCA Calculator →Keep reading if you want the full “rates → markets” chain
And for a deeper global rates anchor:
- 🔗 TNX Explained: Why the 10-Year Treasury Yield Drives Markets
- 🔗 How WTI Oil Can Tighten Financial Conditions Through Inflation and Rates
- 🔗 CAGR Reality Check: What “7% per year” really means
FAQ
Q1. Which is “better,” 2s10s or 3m10y?
They answer different questions. 3m10y is closer to policy tightness; 2s10s adds term premium and medium-term narrative. Use both, but don’t force a single verdict.
Q2. If 2s10s normalizes, does that mean recession risk is gone?
Not necessarily. Normalization can happen for different reasons, including long yields rising. Lags in the real economy still matter.
Q3. Why does 3m10y stay inverted so long?
Because the 3-month rate is tightly linked to current policy settings. If policy is restrictive for a while, the front end can stay elevated even as long rates shift.
Q4. Can markets rally while the curve is inverted?
Yes. Markets price expectations, liquidity, and positioning. That’s why inversion should be a risk-management signal, not an “exit now” rule.
Q5. What’s the simplest “one rule” for retail investors?
Don’t change risk based on headlines. Adjust your plan only when your cashflow risk changes or when your pre-written rebalancing triggers hit.
Q6. Do I need credit spreads to use the curve well?
You don’t need them, but they help. Credit stress is often the channel where macro tightness becomes real economic pain.
Q7. How should non-U.S. investors adapt curve signals?
Overlay FX and global long yields. If global yields rise and your currency weakens, treat conditions as tighter even if local policy hasn’t moved.
Q8. What’s the biggest behavioral trap here?
Turning curve talk into all-or-nothing actions. The goal is durable rules, not perfect calls.