- Korea apartment prices don’t “follow rates” in a straight line; they follow whichever channel is dominant: mortgage rates, demand, or sentiment.
- The same rate level can produce very different outcomes depending on whether transaction volume is stabilizing or evaporating.
- Mortgage rates matter because they change both the discount rate of housing cashflows and the monthly payment constraint buyers actually face.
- Demand is not “how many people want to buy”; it’s how many can still qualify and close—under the current lending rules and income reality.
- Sentiment is not headlines; it’s the day-to-day difficulty of funding and de-risking (spreads, tighter credit, risk-off), which shows up first in liquidity and volume.
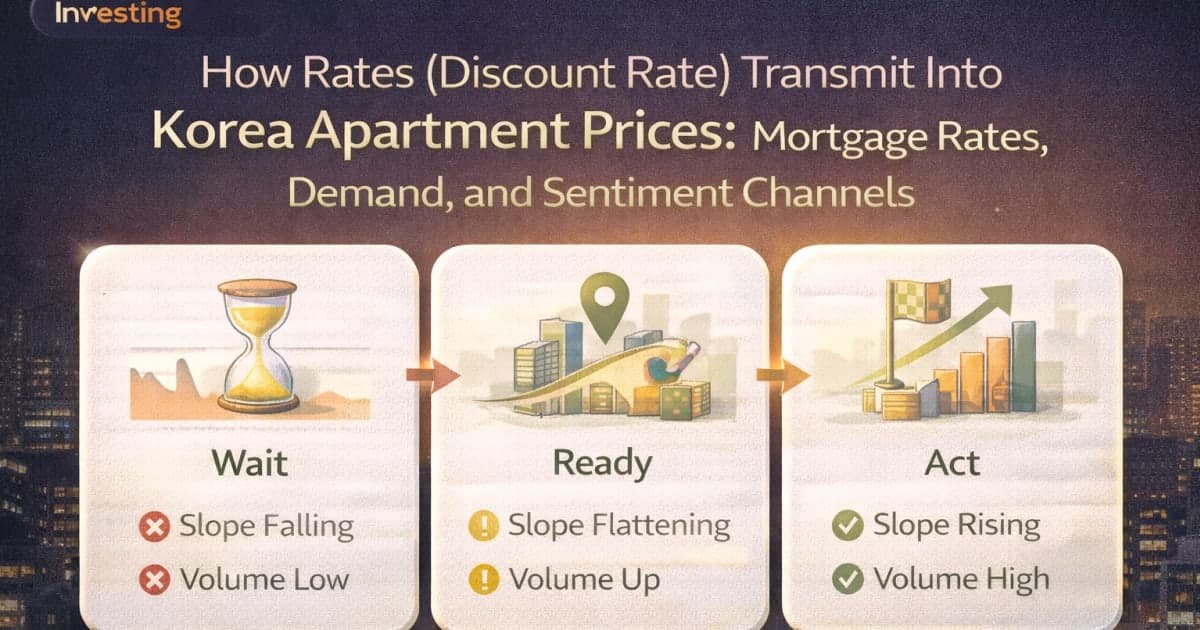
- A practical framework is “support vs break”: support looks like stable median prices plus improving volume; break looks like lower-tail weakness spreading upward while volume dries up.
- The dashboard at South Korea Apartment Transaction Dashboard helps you read distribution, trend, and volume together, so you don’t confuse a bounce with a regime shift.
- Stop asking “will prices go up or down”; start defining triggers for “wait / prepare / execute / stop.”
- Cross-asset context matters: when financial conditions tighten, real estate, equities, and FX can reinforce the same risk-off loop.
INVESTING · RATES & REAL ESTATE
“Rates went up—so apartment prices should fall, right?”
That shortcut is expensive because mortgage rates, demand capacity, and sentiment don’t move together—and sometimes they move in opposite directions.
This post leaves you with a three-channel map and a trigger-based action plan using observable dashboard signals to separate “support” from “break.”
- A simple way to decompose rate shocks into mortgage-rate, demand, and sentiment channels
- A “support vs break” framework you can track on the Seoul–Gyeonggi–Incheon dashboard
- A 3-scenario table (Base/Stress/Relief) with triggers and cross-asset reactions
Scope: no neighborhood calls, no short-term price predictions. The goal is “interpretation → rules → execution discipline.”

Start with the dashboard: read “support vs break,” not “up vs down”
If you invest (or allocate) with real estate in mind, the first skill is not forecasting—it’s recognizing whether the market is holding or breaking.
Use the Seoul–Gyeonggi–Incheon apartment dashboard to see the same market in three lenses at once:
- Distribution: where the median sits and what the upper/lower tails are doing
- Trend: the slope over the last 6–12 months
- Volume: whether liquidity is returning or vanishing
You can access it here: South Korea Apartment Transaction Dashboard.
What to read on the dashboard (mini-checklist near the top)
- □ Distribution (median + upper/lower tail): is weakness isolated to the low end, or spreading into the middle?
- □ Trend (6–12 months): is the slope flattening, rolling over, or re-accelerating?
- □ Volume + recovery signals: are transactions stabilizing (base-building) or spiking (squeeze / FOMO) or drying up (break risk)?

One-line takeaway: Support is when distribution holds and volume improves; break is when volume dries up and lower-tail weakness spreads upward.
The three-channel map: mortgage rates, demand, and sentiment
Rates don’t “hit housing” directly. They transmit through channels that you can observe and diagnose.
Channel 1) Mortgage rates (the discount rate + the monthly payment constraint)
- Definition: the effective borrowing cost buyers actually face (not just the policy rate), which changes affordability and the valuation anchor.
- What to observe: fixed/variable mortgage rates, bank funding costs, and whether lending spreads widen even when benchmark yields fall.
- Limitation: policy cuts can fail to lower effective mortgage rates if spreads, underwriting, or risk premia tighten.
Channel 2) Demand (purchasing power and qualification capacity)
- Definition: the size and strength of the buyer pool that can qualify and close under income, lending rules, and down-payment constraints.
- What to observe: transaction volume, distribution shifts (median vs lower tail), and signs of “only discounted units trade.”
- Limitation: demand can weaken without “price collapse” if supply is constrained or buyers rotate into specific submarkets.
Channel 3) Sentiment (financial conditions and liquidity, not headlines)
- Definition: funding and risk appetite conditions that determine liquidity—how easy it is to finance, de-risk, and transact.
- What to observe: volume, bid-ask gaps (list vs actual deals), spreads/financial conditions, and risk-off loops into FX.
- Limitation: sentiment shifts faster than recorded deal prices; your signals can lead prices by months.
Table 1: rate shocks in one view—what moves first, what to watch, what people get wrong
| Channel | What usually moves first | What to watch on the dashboard | Common trap |
|---|---|---|---|
| Mortgage-rate channel | Payment burden changes immediately | Trend slope begins to flatten; distribution becomes more price-sensitive | Thinking a policy cut automatically lowers your mortgage rate |
| Demand channel | Buyer pool shrinks/expands | Volume changes before price; lower tail trades first | Confusing “people want to buy” with “people can close” |
| Sentiment channel | Liquidity and risk appetite shift | Volume dries up or returns; gap between listings and deals widens | Trading headlines instead of funding conditions |
Interpretation (2–3 lines)
First, volume is often the earliest “truth serum” because it reflects willingness and ability to transact before prices reprice. Second, the same mortgage rate can produce different outcomes depending on whether demand and sentiment are stabilizing or deteriorating. Third, your job is to identify the dominant channel—then define triggers, not predictions.
Turn dashboard metrics into actions (the table you actually use)
This is where anxiety becomes a plan. The dashboard shows numbers; you need rules.
| Dashboard metric | Interpretation | Next action (rule) |
|---|---|---|
| Median holds but lower tail weakens | Weakness is localized; market is bifurcating | Track your budget band only; don’t generalize from average headlines |
| Lower tail breaks and median starts rolling | Weakness is spreading upward (break risk rising) | Shift to “prepare / wait”: financing review, cash buffer, slower execution |
| 6–12 month trend slope flattens | Rate shock is being absorbed | Upgrade from “observe” to “screen”: shortlist areas and price bands |
| Volume stabilizes after a trough | Base-building; liquidity returning | Move to “prepare”: pre-approval, stress test, negotiation plan |
| Volume spikes + prices jump quickly | Short-term squeeze / sentiment-led burst | Use “conditional execute”: verify funding spreads and durable demand |
| Listings-to-deals gap widens | Liquidity stress; price discovery failing | Don’t chase listings; anchor on recent deals and widen margin of safety |
Interpretation (2–3 lines)
This table is designed to force a behavioral upgrade: your action changes with the signal, not with your mood. The most common mistake is to treat a volume spike as “the bottom is in”; sometimes it’s only a short squeeze. Your rules should explicitly require signal agreement (distribution + trend + volume) before you “execute.”
One-line takeaway: A signal without an action rule is just a new way to panic.
Misconception box: “If rates fall, housing must rally”
Misconception (one sentence): “Rate cuts guarantee apartment prices will rise.”
Why it’s wrong (2–3 sentences): Effective mortgage rates depend on spreads and underwriting, not just policy rates. If financial conditions stay tight, the buyer pool doesn’t expand, and volume doesn’t recover sustainably. In that case, “rate cuts” can coexist with flat-to-weak deals because liquidity and confidence remain constrained.
Instead, confirm like this (2 checklist lines):
- □ Check whether effective mortgage rates actually fall for borrowers (spreads/guidelines can offset policy moves)
- □ Require volume stabilization plus distribution support before treating it as a regime shift
Build the “support vs break” framework with observable triggers
“Support vs break” is not a vibe. It’s a simple decision tree using three triggers:
- effective mortgage rate direction (cost of leverage)
- transaction volume behavior (liquidity)
- financial conditions / spreads (risk appetite + funding)
Practical trigger logic (rules you can write down)
- Support-leaning setup: mortgage rates stop rising + volume stops falling + median holds
- Break-leaning setup: mortgage rates stay high (or spreads widen) + volume declines + lower tail breaks and spreads upward
- Transition risk: mortgage rates fall but volume doesn’t respond (often because demand or sentiment is still constrained)

Table 3: Base / Stress / Relief scenarios with triggers and cross-asset reactions
This is not a forecast table. It’s an “if triggers, then posture” map.
| Scenario | Observable triggers (flip conditions) | Apartments (Seoul–Gyeonggi–Incheon) | Equities / Bonds / Cash (typical) | Rules-based posture |
|---|---|---|---|---|
| Base (sticky, mixed) | Mortgage rates plateau; volume flat-to-gradual | Bifurcation: prime holds, weak areas drift | Mixed equities; bonds stabilize; cash opportunity cost moderate | Keep watchlist; execute only with margin of safety and stable volume |
| Stress (financial conditions tighten) | Spreads widen; volume dries; lower tail breaks upward | Liquidity gap widens; median begins rolling | Risk-off: equities pressured; bonds volatile; cash preferred | Stop/slow execution; increase buffer; avoid leverage expansion |
| Relief (conditions ease, liquidity returns) | Effective mortgage rate falls; volume stabilizes and improves | Deals return before prices; selective rebounds | Risk-on: equities recover; bonds calm; cash cost rises | Conditional execute: confirm durable volume + supported distribution |
Interpretation (2–3 lines)
The key is what flips first: in relief, volume often turns before prices. In stress, spreads and funding difficulty can tighten even without dramatic policy moves. Your framework is simply to adjust posture (wait/prepare/execute/stop) as triggers change—not to guess the final level.
One-line takeaway: Regimes flip on triggers (rates + volume + spreads), not on headlines.
Case study 1: “Investor-minded end-user” deciding whether to wait or execute
Profile: a buyer who lives in the home but thinks like an allocator—comparing housing to stocks/bonds/cash.
Risk: overreacting to macro headlines and ignoring the local liquidity reality.
Rules-based approach:
- Step 1 (mortgage rate): define your maximum tolerable payment burden and stress-test it at higher rates.
- Step 2 (volume): require volume stabilization before believing the market is “safe.”
- Step 3 (distribution): check whether weakness is isolated to the lower tail or spreading into the median band relevant to your budget.
Execution rule example (simple and practical):
- “I execute only if effective mortgage rates are not rising, volume is stabilizing or improving, and the median band of my target areas holds.”
Case study 2: Upgrader risk—when “timing” becomes a funding problem
Profile: someone selling one home and buying another (two-leg execution).
Hidden risk: the market can look stable in price while liquidity quietly deteriorates, making the sale leg slower and more painful.
Two-leg risk controls:
- Require a liquidity buffer for the sale delay (3–6 months scenario).
- Anchor decisions on recent deals, not listing prices.
- Treat widening spreads/tighter lending as a “stop trigger” even if prices look calm.
Checklist 1: your personal “rate sensitivity” stress test (cashflow-first)
- □ Write the payment level where you start to feel real stress (not theoretical discomfort)
- □ Stress test at +0.5% and +1.0% on your effective borrowing cost
- □ Decide in advance: fixed/variable/combined based on cashflow stability, not market prediction
- □ For upgrader plans, add a 3–6 month sale delay scenario to your buffer calculation
- □ Put your “stop trigger” in writing: what conditions force you to pause execution?
Checklist 2: dashboard rules—how to use South Korea Apartment Transaction Dashboard without getting emotional
- □ Weekly or monthly cadence beats daily doom-scrolling
- □ Track distribution + trend + volume together; never rely on one signal
- □ Treat “volume stabilization” as a prerequisite for regime change
- □ Don’t generalize from averages; stay within your target price band and region
- □ Use “conditional execute” rules: triggers must agree before you act
- □ Document your rules once; update slowly (avoid rule-drifting every week)
Mid-post A good piece of writing to read together: strengthen your discount-rate intuition
If you want faster intuition for why “discount rate” logic matters across assets (not just housing), these help:
- Understand TNX as a global discount-rate signal (so housing doesn’t feel “isolated”)
- Build a modern risk-budget view (stocks, bonds, cash, real assets) instead of one-asset thinking
Tools: turn narratives into numbers you can compare
If you’re allocating between real estate and financial assets, two simple habits reduce regret:
- Use CAGR to summarize what your alternatives realistically delivered over time.
- Use the goal simulator to translate target price bands and payment limits into a safer execution plan.
Related calculator: Open CAGR calculator
Related calculator: Open goal simulator
Near the end: connect rates → dollar → risk regime (4 links that complete the picture)
For Korea context, financial conditions often show up through the dollar and risk-on/off dynamics. These posts help you map the spillovers:
- Learn how DXY tightens global financial conditions (often before it shows up in local sentiment)
- See the USD/KRW → KOSPI chain (earnings, inflation, foreign flows)
- Understand the S&P 500 risk-on/off transmission into Korea (a useful regime barometer)
FAQs (search-style)
1) Do rate cuts automatically lift Korea apartment prices?
Not automatically. What matters is whether effective mortgage rates actually fall for borrowers and whether volume stabilizes sustainably. If spreads widen or underwriting tightens, policy cuts may not translate into meaningful payment relief.
2) What’s the fastest way to see “support vs break” without predicting prices?
Use three dashboard lenses together: distribution (median + tails), trend (6–12 months), and volume. Support is when the median band holds while volume stops falling and begins improving. Break risk rises when volume dries up and lower-tail weakness spreads upward.
3) Why is transaction volume often more important than price headlines?
Volume reflects liquidity and the ability to close deals before prices reprice. Prices can look “stable” while transactions disappear, which is often the precondition for later repricing. Volume is also harder to fake than sentiment.
4) How should I think about “discount rate” in real estate investing?
Real estate has a long-duration component—future housing services or rental-equivalent benefits are implicitly discounted. Higher effective rates raise the discount rate and tighten the payment constraint at the same time. The dominant effect depends on demand and sentiment.
5) What triggers suggest a “relief” regime rather than a temporary bounce?
A relief regime is more credible when effective mortgage rates fall and volume stabilizes/improves while distribution holds in your target band. A bounce is more likely when prices jump with a short-term volume spike but financing conditions don’t genuinely ease.
6) How do spreads and financial conditions show up for ordinary buyers?
You feel it when your quoted mortgage rate doesn’t fall even though benchmark yields do, or when approval becomes harder and limits shrink. That’s spreads/underwriting tightening in real life. Treat that as a regime input, not a minor detail.
7) If I’m an upgrader (sell then buy), what’s the #1 risk to manage?
Liquidity timing. Your selling leg can slow dramatically even if headline prices look stable. Build a buffer for sale delay, and define a stop trigger if funding conditions tighten while liquidity deteriorates.
8) How often should I check the dashboard?
Weekly or monthly is usually enough. The goal is not constant monitoring but consistent rule-checking. Use the same three lenses each time to avoid emotional over-trading.