- War headlines can lift oil even when physical supply hasn’t changed yet—because the market prices risk pathways, not just barrels.
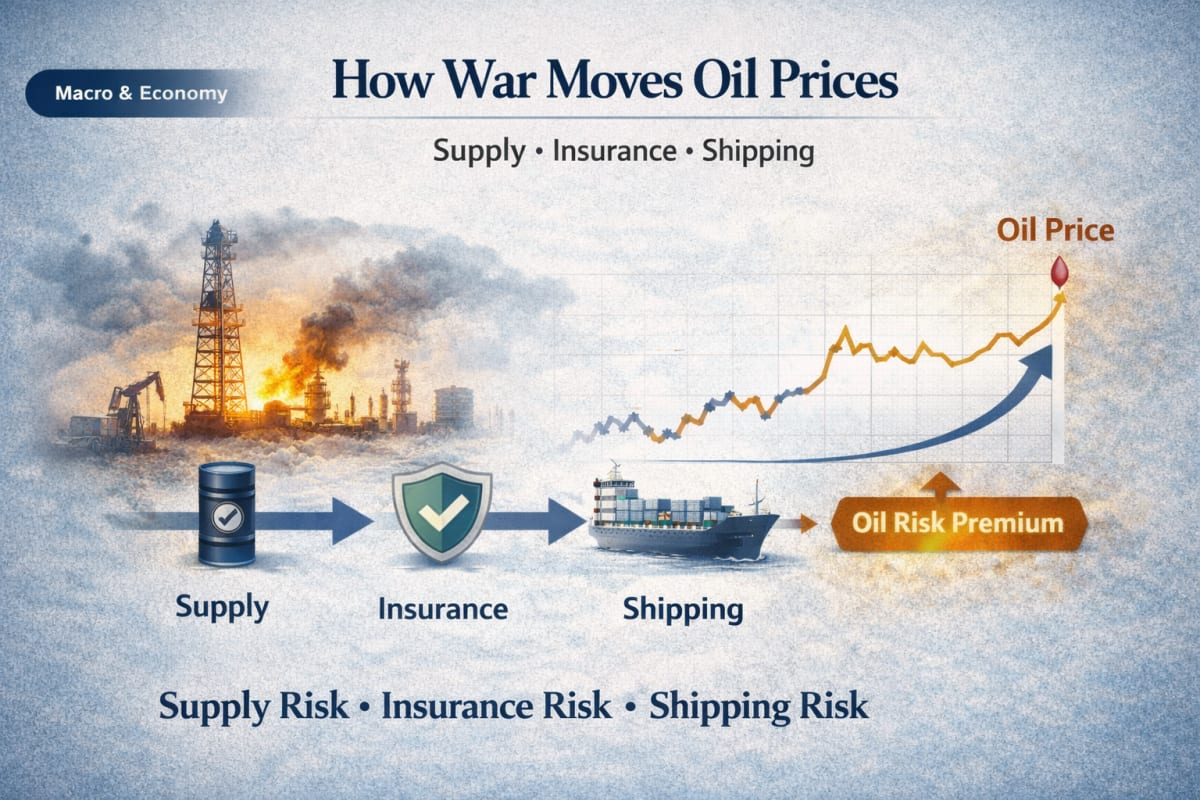
- The price impact usually arrives in three steps: supply constraints, insurance/war-risk premiums, and shipping/freight bottlenecks.
- “Risk premium” is often a bundle of costs (insurance + time + optionality) that can fade quickly if the threat dissipates.
- Insurance and freight are not side stories—on some routes they become the mechanism that turns fear into delivered energy prices.
- Expectations matter because refineries, traders, and inventories respond to the probability distribution, not the single most-likely scenario.
- For Korea, oil shocks often transmit through import prices → inflation expectations → FX (USD/KRW) → risk sentiment and equity flows.
- The fastest way to read oil-on-war news is to classify the headline into: barrels at risk, routes at risk, or timing at risk.
- A rules-based framework beats hot takes: define what you will track (WTI/Brent spread, freight signals, USD/KRW) and what would “flip” your interpretation.
- You don’t need to predict war outcomes; you need to map how risk gets priced and when the market stops paying for it.
ECONOMICS · GEOPOLITICS · OIL
When conflict hits the news, people look for one explanation: “supply shock.” But oil often moves before supply changes—and sometimes keeps moving even when supply is intact.
This post gives you a simple reading model: Supply (barrels), Insurance (war-risk pricing), and Shipping (route/time capacity). Once you can place a headline into these three buckets, the price action becomes less mysterious—and less emotionally contagious.
- Learn the 3-step transmission from war headlines to oil prices
- Spot when the move is mostly risk premium versus real shortage
- Apply a Korea overlay: import inflation → USD/KRW → risk sentiment
Scope: interpretation framework and checklists, not forecasts or trade calls.
The three-step model: barrels, premiums, and routes
Most “war and oil” explanations compress everything into one sentence. The market doesn’t.
In practice, oil prices respond through three channels that can show up in different combinations.
Supply (barrels at risk)
Production, exports, storage, and spare capacity. This is the “classic” channel.Insurance (war-risk premiums and coverage)
If insurers reprice risk or restrict coverage, shipping becomes more expensive or less available. That cost can be reflected in oil prices and, more importantly, in delivered energy costs.Shipping (freight, routes, and time)
Even if barrels exist, if the route becomes longer, constrained, or volatile, time and capacity become priced. “Same supply” can still mean “higher delivered price.”
The market is not pricing the news headline—it’s pricing the path from risk to delivered barrels.
Table 1 — Classify the headline before you react
| Headline type | What’s actually threatened | What usually moves first | What can fade fast | What tends to persist longer |
|---|---|---|---|---|
| “Production/export facility hit” | Barrels and export capacity | Front-month crude, product cracks | Panic spikes if damage is small | If repairs are slow or sanctions tighten |
| “Strait/route risk rises” | Time, freight, route reliability | Freight proxies, regional spreads | Risk premium if threats cool | Longer routes can keep costs elevated |
| “Sanctions / enforcement risk” | Who can buy/sell and how | Spreads, alternative grades | Headlines without enforcement | Compliance and rerouting frictions |
| “Retaliation rhetoric” | Probability distribution (not yet barrels) | Volatility, options skew | If no follow-through | If market reprices tail risk |
Interpretation (read this after the table):
If the headline is mostly “route risk,” don’t over-interpret it as an immediate physical shortage. Route risk can lift prices via time and cost, and then unwind quickly if risk perception drops.
If it’s “sanctions/enforcement,” the impact can be slower but stickier because it changes trade flows and compliance costs.
Step 1 — Supply: why “barrels at risk” is still only the beginning
Supply matters, but the market cares about two sub-questions:
Are barrels lost, or just redirected?
Redirected barrels can still pressure certain grades/regions even if global supply is unchanged.Is spare capacity credible and deployable?
Spare capacity isn’t helpful if it can’t replace the exact quality or timing the market needs.
A helpful mental shift: oil is not one product.
Quality (sulfur), location, and logistics shape what “shortage” means in practice.

Checklist 1 — “Is this a real supply shock?” (90-second version)
- Is production/export volume actually disrupted, or is it risk rhetoric?
- Are inventories being drawn or merely repositioned (floating storage, regional builds)?
- Are spreads telling a shortage story (front-month stronger than later months), or a fear story (volatility spike without tightness)?
- Is the constraint local (one region/grade) or global (broad shortage)?
- Is there a visible substitute (other grades, strategic releases, demand response)?
“Supply shock” isn’t a headline label—it’s a set of observable frictions in flow, inventory, and timing.
Step 2 — Insurance: the hidden lever that turns risk into cost
Insurance is where “risk” becomes a number you have to pay.
When war-risk rises, shipping may require:
- higher premiums (war-risk add-ons),
- stricter routes or documentation,
- fewer willing carriers.
This doesn’t always show up as a dramatic headline, but it can quickly become a meaningful incremental cost, especially on routes perceived as exposed.
“Insurance is just a small fee, so it can’t move oil.”
In risk episodes, insurance can act like a *rate limiter*: fewer ships, higher costs, and less predictable delivery windows. Markets price not only the average cost, but the risk of disruption and delays.
Table 2 — Supply vs insurance vs shipping: what each one changes
| Channel | What changes in the real world | What price is “paying for” | Common market tell | Typical fade condition |
|---|---|---|---|---|
| Supply | Actual barrels available | Scarcity | Inventory draws, tight physical differentials | Repair, substitution, demand response |
| Insurance | Coverage cost and willingness | Tail risk and compliance friction | Premium chatter, higher delivered costs | De-escalation, restored coverage appetite |
| Shipping | Route time, freight capacity | Time value and reliability | Regional spreads, freight-sensitive products | Routes normalize, congestion clears |
Interpretation:
If you see price action without evidence of tightness (inventories and physical markets calm), it may be insurance/shipping risk being priced.
These components can unwind fast when perceived tail risk drops—even if the geopolitical story isn’t “resolved.”
Step 3 — Shipping: why route risk can lift prices without losing a single barrel
Shipping is the bridge between crude and consumption.
If a key corridor becomes risky:
- ships reroute (longer distance),
- effective capacity drops (same number of ships carry fewer barrels per month),
- schedules become less reliable (higher buffer inventories needed).
The system reacts by paying for optionality: “I’d rather secure delivery now at a higher cost than risk being short later.”

Table 3 — The three-scenario lens (with “flip conditions”)
| Scenario lens | What is true in this lens | Oil move driver | What you should watch | Flip condition (changes your read) |
|---|---|---|---|---|
| Base: contained risk | Threat exists, flows mostly continue | Mostly risk premium | Volatility, short-term spreads, freight chatter | Physical tightness appears (draws, bottlenecks) |
| Escalation: route/premium shock | Coverage and routing become constrained | Insurance + shipping cost rises | Freight-sensitive signals, regional spreads | Coverage normalizes / rerouting eases |
| De-escalation: premium unwind | Tail risk probability drops | Risk premium fades | Volatility falls, spreads relax | New sanctions/enforcement raises structural friction |
Interpretation:
This is not a forecast table—it’s a classification tool. Pick the lens that matches the evidence, then update only when a flip condition is met.
This prevents the “headline loop” where you re-interpret everything every day.
Korea overlay: from oil to import prices to USD/KRW and sentiment
Korea is a large energy importer, so oil shocks often propagate through the import-cost channel.
A clean way to think about it is the “pricing chain”:
Oil (global USD price) → import prices → inflation expectations → FX (USD/KRW) → risk sentiment and financial conditions
Two important reminders:
- The transmission is not instantaneous. Some parts hit quickly (FX and sentiment), others show up with lags (inflation data).
- FX can amplify or dampen the local impact. USD/KRW moves can matter as much as the oil move.
Here’s a clean baseline on FX mechanics you can use as your anchor when headlines get noisy:
And if you want the full “Korea chain” from WTI into inflation, FX, rates, and earnings, use this as the longer map:
For Korea, oil is rarely “just energy”—it’s a macro input that often travels through FX and inflation expectations.
Table 4 — Korea reading grid: what changes, what it often means, what to do with it
| Observable change | What it often signals in Korea | What not to assume | Practical reading rule |
|---|---|---|---|
| Oil up, USD/KRW stable | Import-cost pressure but limited FX amplification | “Inflation will surge immediately” | Watch expectation channels, not one CPI print |
| Oil up, USD/KRW weaker (KRW down) | Double whammy on import costs | “It’s only oil” | Treat as tighter financial conditions risk |
| Oil up, risk-off mood rises | Funding stress, higher risk premia | “KOSPI must drop” | Look for duration/FX sensitivity in the narrative |
| Oil spikes then fades fast | Premium unwind more than shortage | “Crisis ended” | Re-check flip conditions, not emotions |
Interpretation:
The key is to separate “price move” from “local impact.” Korea’s local impact depends heavily on FX behavior and sentiment.
When USD/KRW amplifies the oil move, the macro narrative shifts faster because it touches financial conditions.
Checklist 2 — Korea overlay (what to check before concluding “this is inflationary”)
- Did USD/KRW amplify the move (KRW weakening), or dampen it?
- Are import prices and inflation expectations moving, or is it a short-lived premium spike?
- Is risk sentiment turning “risk-off” broadly, or is it contained to energy headlines?
- Are rates (like TNX) moving in a way that tightens conditions further?
- Are policy expectations shifting, or is this mostly a temporary cost shock?
Two mini case studies: same headline, different interpretation
Case A — “Route risk rises” but supply flows continue
You see oil pop on risk headlines, but there’s limited evidence of immediate physical tightness.
In this case, the move may be dominated by insurance and shipping uncertainty.
How to act (interpretation-wise):
- Use the three-step model: treat it as “premiums/routes,” not “missing barrels.”
- Wait for flip conditions: do you see actual bottlenecks and inventory draws?
- Avoid overfitting one day’s move into a macro regime shift.
Case B — “Sanctions enforcement tightens” and rerouting becomes costly
Here the move can be slower, but more persistent. The key is friction: compliance, rerouting, and grade mismatch.
Even if global supply is stable, delivered costs can remain elevated.
How to act (interpretation-wise):
- Focus on persistence indicators: spreads, trade flow adaptations, and sustained freight constraints.
- Treat “premium” as potentially structural, not purely emotional.
- Re-check Korea overlay: if USD/KRW weakens alongside, local sensitivity rises.
Practical action plan: rules that stop the headline treadmill
You don’t need a perfect model. You need a repeatable routine.
- Classify the headline (barrels / premiums / routes).
- Pick the scenario lens (base / escalation / de-escalation).
- Write your flip condition in one sentence (what evidence would change your lens).
- Run the Korea overlay checklist (USD/KRW, expectations, sentiment).
- Avoid forecasting; update only when flip conditions occur.
If you want a broader framework so oil headlines don’t fool you by “feeling inflationary” every time, these posts help you anchor the macro basics:
- 🔗 Inflation–rates framework (so oil headlines don’t fool you)
- 🔗 How DXY reshapes stocks, FX, and liquidity
- 🔗 TNX explained: why the 10Y yield drives markets
- 🔗 Why USD/KRW changes the mood of the KOSPI

FAQs — war headlines, oil, and the risk premium mechanism
Why does oil jump when no supply is actually disrupted?
Because markets price probabilities and frictions. Even if supply is intact today, insurance and route uncertainty can increase delivered costs and raise the value of near-term optionality. The move can be a “risk premium” that fades if the threat dissipates.
What is an oil “risk premium” in plain terms?
It’s the extra price paid for uncertainty, tail risk, and delivery reliability. It can include insurance add-ons, freight/time costs, and the market’s willingness to pay to avoid being short during a disruption. It’s not always visible in one statistic.
How can I tell “real shortage” from “premium pricing”?
Look for signs of physical tightness: inventory draws, sustained strength in physical differentials, and persistent front-end tightness. If those are absent and volatility is doing most of the talking, premiums/routes may be the dominant channel. Use flip conditions rather than gut feelings.
Why does shipping matter if the oil exists somewhere?
Because oil must be delivered at the right time and place. Longer routes reduce effective capacity, increase time value, and raise delivered costs—especially when scheduling reliability deteriorates. The system pays more for certainty when the route becomes risky.
How does this usually affect Korea specifically?
Korea is sensitive through the import-cost channel and FX amplification. Oil up can pressure import prices and inflation expectations, while USD/KRW can either amplify or dampen the local effect. Risk sentiment can also shift financial conditions even before inflation prints move.
Does de-escalation automatically mean oil falls back?
Not automatically. If the move was mostly premium pricing, it may unwind faster. If trade flows changed structurally (sanctions/enforcement, persistent rerouting), some of the elevation can persist. That’s why scenario lenses and flip conditions matter.
Should I watch WTI or Brent for geopolitical episodes?
Both matter, but the “right” reference depends on which region and route the risk affects. Some episodes show up more in regional spreads and differentials than in a single benchmark. A framework approach beats choosing one ticker.
What’s one rule to avoid overreacting to oil-on-war news?
Update your interpretation only when a flip condition is met—such as clear physical tightness, sustained freight constraints, or meaningful FX amplification. Headlines change daily; constraints don’t. This keeps you out of the emotional loop.