- Most FIRE plans “break” not from math errors, but from inputs that assume a perfect decade instead of a real life.
- If your model uses nominal returns but your spending is effectively real (inflation-adjusted), your FIRE number will drift every time inflation surprises you.
- The biggest hidden risk is not low average returns—it’s sequence risk (bad early years while you’re withdrawing).
- Taxes don’t need perfect precision to matter; ignoring them is equivalent to assuming a free boost to your return.
- Healthcare and housing “surprise” costs aren’t optional line items—they’re predictable volatility that should be modeled as risk costs.
- 401(k)/IRA contributions are powerful, but FIRE models still go wrong when people confuse account balance with spendable after-tax cash flow.
- Social Security can be a major cash-flow lever, but it also adds timing uncertainty that should be stress-tested, not treated as guaranteed perfection.
- A good FIRE plan isn’t a single result—it’s a range that stays workable when you nudge returns, inflation, and savings.
- Your fastest upgrade is a simple sensitivity mission: change returns / inflation / savings and watch which input breaks the plan first using Fire Calculator.
PERSONAL FINANCE · FIRE · ASSUMPTION CHECK
“I ran a FIRE calculator and the number looked great… until I changed one input and everything fell apart.”
That’s normal—and it’s usually a sign your model is overfit to optimism. Real life includes taxes, healthcare volatility, lumpy expenses, and markets that don’t deliver smooth averages.
This post gives you a framework: 7 modeling mistakes + the “reality downshift” fix for each + a 10-minute sensitivity check so your plan survives imperfect inputs.
- How to turn “nice-looking” assumptions into workable ranges
- How to model taxes and cash flows without tax advice
- How to stress-test returns, inflation, and savings so you know what actually matters
Scope note: This is educational, not personalized tax/legal/financial advice. No stock/ETF recommendations. The goal is “assumptions → rules → sensitivity checks.”
Why FIRE models “feel wrong” even when the math is correct
A FIRE calculator will do exactly what you ask.
The problem is that many people accidentally ask it to model a world where:
- returns are smooth,
- inflation behaves nicely,
- taxes barely exist,
- healthcare surprises don’t happen,
- and spending is stable forever.
That’s not pessimism—that’s simply reality.
One-line takeaway: The point of FIRE modeling isn’t getting a pretty number; it’s building a plan that stays workable under imperfect inputs.
The required table: Assumption → optimistic → conservative → what changes
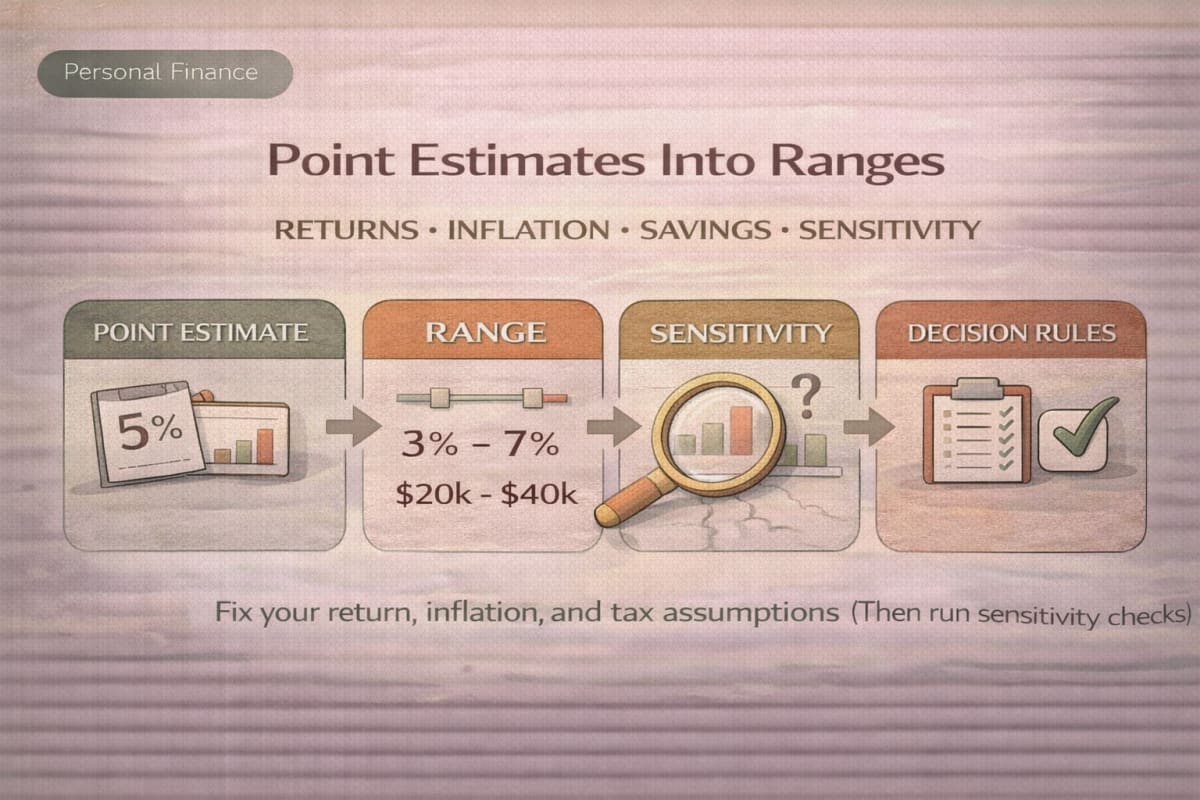
This table is not telling you “the correct” assumptions.
It’s giving you a practical way to stop betting on a single point estimate.
| Assumption | Optimistic input (common) | Conservative input (reality downshift) | What changes in your FIRE model |
|---|---|---|---|
| Return (nominal) | “Long-term average” used as certainty | Lower return, plus acknowledge variability | Your required portfolio size and failure risk can shift dramatically |
| Inflation | One neat rate forever | Higher or spending-weighted inflation | Real spending grows faster; withdrawals become harder to sustain |
| Taxes | Ignored or assumed negligible | Modeled as a drag on spendable withdrawals | “Portfolio value” may look fine while “after-tax spending” fails |
| Savings | Assumed constant and uninterrupted | Reduce savings in one or more years | Time-to-FIRE shifts more than most people expect |
| Withdrawal behavior | Fixed withdrawals regardless of conditions | Guardrails (flexible lifestyle spending) | Plan survivability improves without needing prediction |
| Big costs | Smoothed into monthly averages | Explicit “risk costs” bucket (healthcare/housing) | Prevents surprise years from forcing permanent withdrawal increases |
| Social Security | Assumed full, on-time, perfect | Modeled with timing uncertainty and range | Your early retirement years may be tighter than your long-run average |
Interpretation (2–3 lines):
- Most mistakes come from treating uncertain inputs as fixed certainties.
- Your job is to build a workable range: optimistic, base, and conservative.
- Then use sensitivity checks to identify your plan’s “breakpoints.”
Misconception box: “If I use a long-term average return, the plan works”
Why it’s wrong: retirements don’t fail on average—they fail in the early years when withdrawals meet a drawdown (sequence risk), or when inflation and lumpy expenses hit together.
Check instead (2-step): (1) Run a conservative return + higher inflation scenario, and (2) add a rule that reduces lifestyle spending when the plan is under pressure.
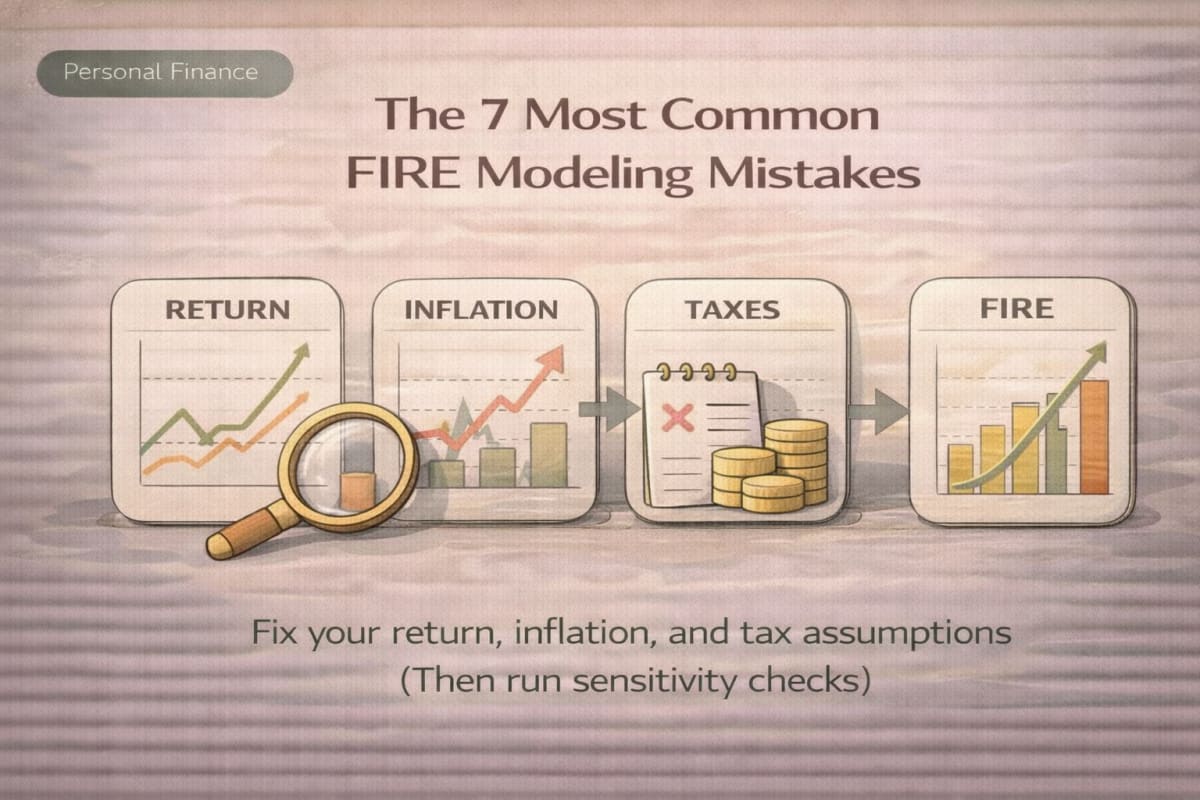
The 7 most common FIRE modeling mistakes (and how to fix each)
Below is the practical version: symptoms → why it happens → how to fix the input (without pretending we can predict markets).
Mistake 1) Mixing nominal and real thinking
Symptom: Your model “works,” but your lifestyle feels tighter each year.
Why it happens: You plug in nominal returns while mentally tracking spending in real terms (or vice versa).
Fix: Always ask: “Are my inputs nominal or real?” Then keep the model consistent (return + inflation + spending).
Practical downshift:
- If you input nominal return, input inflation too, and interpret results as inflation-adjusted spending.
- If you think in real returns, be explicit and don’t double-count inflation.
Mistake 2) Treating inflation as a single neat number
Symptom: Your withdrawals look fine in the calculator but feel stressed in real life.
Why it happens: Retirees often experience spending-weighted inflation: housing, insurance, and healthcare can rise differently than “headline inflation.”
Fix: Stress-test inflation higher than your baseline, and treat core costs as less flexible than lifestyle costs.
Mistake 3) Ignoring taxes (or assuming the same tax reality forever)
Symptom: “My portfolio should cover $X per year,” but after-tax spending falls short.
Why it happens: Different account types (taxable vs tax-advantaged) and withdrawal timing can change what’s spendable.
Fix: Model taxes conceptually as a drag—without pretending you know your exact future bracket.
Practical ways to do this without tax advice:
- Convert your spending target into “needs to land in my checking account” (after-tax framing).
- Or apply a conservative “effective tax drag” assumption in scenario testing (range, not precision).
Mistake 4) Assuming constant savings until the exact FIRE date
Symptom: Your plan assumes perfect discipline and uninterrupted income.
Why it happens: Life happens: business volatility, job transitions, family costs, health events.
Fix: Run a “savings shock” scenario (e.g., -20% savings for 1–2 years) and see how much it shifts the timeline.
This is also where 401(k)/IRA framing matters:
- Contributions are powerful—but your plan should survive a year where you can’t max contributions.
- Treat contributions as a lever, not a guarantee.
Mistake 5) Failing to model lumpy expenses (healthcare + housing as “risk costs”)
Symptom: The model works in average years, then a few big bills force permanent withdrawal increases.
Why it happens: People put everything into “annual spending” and forget that some costs arrive as shocks.
Fix: Create a risk-cost line item: healthcare surprises, deductible events, home repairs, insurance premium spikes.
U.S.-specific reminders (conceptual):
- Healthcare costs can be volatile year to year.
- The years before Medicare eligibility (if applicable) can be structurally different from later years.
Mistake 6) Using a fixed withdrawal rule with no guardrails
Symptom: You assume a constant withdrawal path even when conditions change.
Why it happens: It’s easier to model a straight line than a rules-based plan.
Fix: Add a simple guardrail: protect essentials, flex lifestyle, replenish buffers after shock years.
Guardrails don’t require prediction. They require a rule you’ll actually follow.
Mistake 7) Overconfidently modeling Social Security (timing + uncertainty)
Symptom: Your plan looks safe because Social Security “fills the gap,” but early retirement years are fragile.
Why it happens: People treat Social Security as a guaranteed plug-in number and ignore timing and policy uncertainty.
Fix: Model Social Security as a cash-flow lever with a range. Then test early-years survivability without perfect assumptions.
One-line takeaway: Don’t “optimize” your FIRE number—stress-test your early years and your buffers.
A compact “mistake → symptom → fix → sensitivity lever” table
| Mistake | What it looks like | Reality fix | Best sensitivity lever to test |
|---|---|---|---|
| Nominal/real mismatch | Model feels “off” vs lived experience | Keep return/inflation/spending consistent | Inflation +1% |
| Single inflation rate forever | Spending drifts upward faster than expected | Use higher inflation scenario or weighted inflation | Inflation +1% |
| Taxes ignored | Portfolio looks ok, cash flow fails | Treat taxes as drag or after-tax spending target | Return -1% |
| Savings assumed perfect | FIRE date looks too close | Add “savings shock” year(s) | Savings -20% |
| Lumpy costs ignored | One bad year breaks the plan | Add risk-cost reserve line | Savings -20% + inflation +1% |
| No guardrails | Withdrawals keep rising in downturns | Flex lifestyle spending when stressed | Return -2% early years scenario |
| Social Security overconfidence | Early years too tight | Model timing uncertainty, test without it | Reduce Social Security assumption in conservative scenario |
Interpretation (2–3 lines):
- When you don’t know what number to pick, don’t guess—test the plan’s response to changes.
- Most FIRE plans are most sensitive to either real return (return minus inflation) or savings.
- The best model is the one that tells you what lever matters most for your situation.
Two scenarios: Optimistic vs conservative (how the story changes)
These are illustrative examples meant to show the mechanism, not provide forecasts.
Scenario A: Optimistic model (looks great on paper)
- Return assumption: higher and smooth
- Inflation: low and stable
- Taxes: mostly ignored
- Savings: constant, uninterrupted
- Lumpy costs: smoothed into averages
- Social Security: assumed on-time and full
Result pattern: FIRE number looks low, timeline looks fast, and the plan depends on “nothing going wrong.”
Scenario B: Conservative model (survives real life)
- Return assumption: lower (or treated as variable)
- Inflation: higher or spending-weighted
- Taxes: modeled as drag on spendable withdrawals
- Savings: includes a -20% year or a gap period
- Lumpy costs: explicit risk-cost line
- Social Security: modeled with timing uncertainty
Result pattern: FIRE number rises, timeline may extend, but you gain something more valuable: a plan you can operate.
One-line takeaway: Optimistic scenarios motivate; conservative scenarios keep you solvent.

Mid-point action: run the sensitivity mission with the FIRE calculator
Use Fire Calculator and enter your baseline inputs first: annual spending (USD), retirement horizon, and your baseline return + inflation.
Then run the sensitivity mission: change returns (-1% / -2%), inflation (+1%), and savings (-20%) one at a time and note which change breaks your plan first.
How to interpret the sensitivity results (so you don’t panic)
- If return changes dominate: your plan is return-sensitive → buffers and guardrails matter more.
- If inflation changes dominate: your plan is purchasing-power-sensitive → core costs need stronger protection.
- If savings changes dominate: your plan is behavior/cash-flow-sensitive → contribution automation and flexibility matter more than tiny return tweaks.
A good piece of writing to read together (concept connection, not just “more reading”):
- CAGR explained (so your return assumption is reality-based)
- What “7% annual return” really means (why averages can mislead)
A practical way to “downshift to reality” without overcomplicating your model
If you only do one upgrade, do this:
- Build a baseline (what you hope is true).
- Build a conservative case (what could be true).
- Add one rule (guardrail) for what you’ll do when the conservative case starts happening.
Minimal guardrail example (conceptual)
- Essentials are protected (housing, food baseline, insurance baseline).
- Lifestyle flexes (travel, dining, extras) when the model is under stress.
- After a shock year, you rebuild the buffer first before lifestyle expands again.
This is how you prevent one bad year from turning into a permanent withdrawal increase.
Checklists you can use today
Checklist 1: Fix inputs before you debate withdrawal rates
- Are my return and inflation assumptions consistent (nominal vs real)?
- Did I test inflation +1% (spending-weighted reality)?
- Did I model taxes conceptually (after-tax spending or tax drag range)?
- Did I include a savings shock scenario (at least one -20% year)?
- Did I separate lumpy “risk costs” (healthcare/housing) from regular spending?
- Did I model Social Security with timing uncertainty (not perfect certainty)?
- Do I have at least one guardrail rule I’ll actually follow?
Checklist 2: The 10-minute sensitivity mission (repeat yearly)
- Baseline: set spending, horizon, return, inflation, savings
- Return test: run -1% and -2% return
- Inflation test: run +1% inflation
- Savings test: run -20% savings (or 0 for a year)
- Write down the “breakpoint”: which change fails first?
- Choose one action lever this year to strengthen that breakpoint

Near the end: the second sensitivity run (your final verification)
You’ve now corrected the model. The final step is to verify that your plan still works when you deliberately “stress” it.
Go back to Fire Calculator and re-run with your conservative case: use a lower return, higher inflation, and reduced savings (if you’re still accumulating).
Mission: compare baseline vs conservative outputs and confirm your rule: what spending flexes first, and what buffer you rebuild after a shock year.
If you do this, your FIRE model stops being a motivational poster and becomes a plan you can operate.

Related reads that make your FIRE model more realistic
A good piece of writing to read together (next puzzle pieces):
- Build the foundation first: budgeting, emergency funds, and long-term investing
- Emergency fund sizing by risk (not generic “months”)
- Debt vs investing: a rules-based threshold approach (reduces modeling anxiety)
FAQs
Q1. What’s the single biggest FIRE modeling mistake?
Treating uncertain inputs (returns, inflation, taxes, savings) as fixed certainties. The fix is to use optimistic and conservative scenarios and run sensitivity checks.
Q2. Should I model returns as nominal or real?
Either can work—what matters is consistency. If you use nominal returns, include inflation. If you use real returns, don’t double-count inflation elsewhere.
Q3. How do I account for taxes without personalized tax advice?
Use a range-based approach: model taxes as a drag on spendable withdrawals or translate your target spending into “after-tax cash needed,” then test sensitivity with lower effective returns.
Q4. Why is inflation +1% such a big deal in FIRE models?
Because retirement is long and spending compounds upward. A small inflation change affects every future year, which can materially change sustainability.
Q5. How should I treat 401(k) and IRA contributions in the model?
Treat contributions as a savings lever, not a guaranteed constant. Your model should survive a year where contributions drop. Also remember: account balance is not the same as after-tax spending power.
Q6. How should I include Social Security?
Use it as a cash-flow lever, but model timing uncertainty and test early retirement years without perfect assumptions. Your plan should not depend on ideal outcomes.
Q7. What are “lumpy expenses,” and why do they break plans?
They’re irregular but predictable shocks (healthcare spikes, home repairs, insurance premium jumps). If you smooth them into averages, a bad year forces permanent withdrawal increases. Model them as risk costs with buffers.
Q8. What does a successful sensitivity check look like?
Not “the plan never changes,” but “the plan stays workable.” You can identify which lever matters most and you already have a rule for how to respond when stress shows up.